September 2009

  • Sometimes Simple Is Better

    This simple communication tool had a huge impact on our project management.

    I took for granted that our team was working towards the same vision, that we were aligned, and that we had a clear understanding of what constituted success.I was only partly right.  Here are some of the things we did to fix it.

    Perception Changes With Focus.

    The timeframe someone focuses on tells a lot about that person's level in a company. For example, people producing work tend to focus on what they're doing that day or week. Managers have a slightly longer timeframe, and may be looking at monthly production. Some executives are looking at the next year or two; while the CEO is often looking much further out than that.

    On a generic level, it is easy to think about the future. On the other hand, for someone working on the day-to-day operational details, it's much harder to figure-out how to go from where we are to even the very next step.

    Alignment Is a Key to Momentum and Progress.

    Aligning vision, strategy, and tactics is important to make sure that
    what we're doing now supports our ultimate goal and moves us in the
    right direction. Consequently, one of the goals of the planning exercise is to create a clear path so each person understands what they're doing, and how what they're doing up takes us closer to our ultimate goal.

    A Quick Look Backwards.

    One of the ways we have done this is to talk about some of the past iterations of technologies that we've gone through.  Doing this helps reinforce how much progress we've already made, as well as to recognize which things really marked the ending of one phase – or the beginning of another.

    Looking back, we identified seven major phases of technology. We agreed to call what we're currently doing version 7.0. We also agreed on which features and functions would constitute version 8.0. In other words, here is where we are … And here is where we want to be.

    A Clear Path Forwards.

    Then, we identified five stages to get from here to there. The first stage will take about one month, and we're calling it version 7.1. The key is that the team understands that 7.1 Is an important milestone on the path towards a bigger goal. However, it's specific, measurable, and actionable. Each person understands what they have to do, and what the project plan looks like to get from here to there.

    Accepting the Journey.

    We talked about why version 7.1 was an important step for us. We discussed what it will entail, and how we will know that it's complete. Then we had each person sign the sheet indicating that they agreed with and accepted these specifications.

    It sounds silly, but getting people to sign the sheet that documented a complete understanding of "who, what, when, where, and why" was important and freeing. It unlocked each person's unique abilities and gave them a clear path forward.

    Think about an area in your business or personal life that could use a little more transparency, clarity and unconditional agreement. Perhaps this simple tool can make it better?

    Hope that helps.
  • Capitalogix Commentary 09/27/09

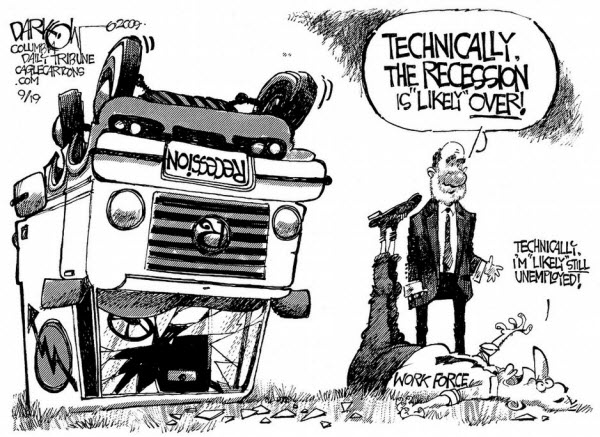
    Bernanke said that the recession is "most likely over"; but added that the recovery would be jobless.

    Recession Likely Over Cartoon

    Moreover, recent surveys show that many companies expect to shed jobs
    in the next 12 months and do not expect to reach former staffing levels
    before 2012. The question is: How will that affect the economy and the markets?

    Are They Buying or Selling the News?

    I'm paying attention to indications that the markets have begun selling-off after news.  This is typical behavior near tops and during bearish swings.  In contrast, during the recent rally, the Markets often went up despite bad news.

    There Still Is Not Much Selling Pressure.

    From a technical and market psychology perspective, we are seeing short spikes of intra-day selling that have not had much follow-through.  However, it seems to me that fewer people are buying the dips and a bunch of negative divergences are in place.  All that means is that it is time to watch major trend lines; they will tell you when something changes. 

    Is Something Fishy Churning Just Beneath the Surface of Our Markets?

    Several articles claim that up to 40% of the volume in the New York Stock Exchange, recently, occurred in just four financial stocks: Bank of America, Citigroup, Fannie Mae, and Freddie Mac

    It could be normal, or at least something simple and innocent. Nonetheless, I am suspicious and a little skeptical that such a small group of low-priced stocks could account for such an unusual percent of the trading volume on the NYSE. Realistically, I doubt that it was retail investors jumping-in to drive the rally higher.

    So was it churning, high-frequency flash trading, or a tacit government
    sanctioned way to allow certain funds and brokers to profit while
    making the markets appear healthier than they are?  I don't know; but it has started people talking.  And it is something that will stay on my radar.

    The Changing Face of the Giants of Finance.

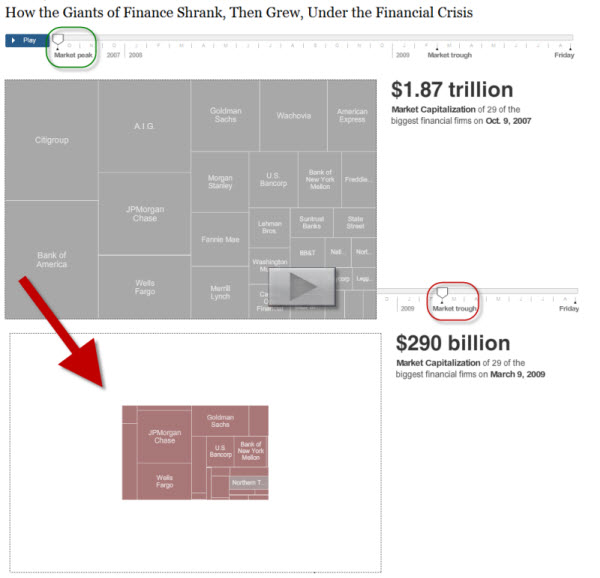
    On a related topic, the NYTimes had a great interactive graphic showing how the Giants of Finance have changed.  Since the stock market’s peak in October 2007, Wall Street’s landscape has been permanently altered. Lehman Brothers, gone. Bear Stearns, gone. Merrill Lynch, gone. Main Street’s landscape has also changed. Wachovia, National City, Washington Mutual and Countrywide, all gone. These financial giants all crumbled under the weight of the financial crisis.

    Those that were left shrank down to a fraction of their former market capitalizations by early 2009, but since then, they all have grown. While most are nowhere near their former size, two — JPMorgan Chase and Wells Fargo — are slightly larger than they were at the market’s peak.  Click the image to play.

    090927 Giants of Finance

    Let me know what you think. Hope you have a great week.

    Business Posts Moving the Markets that I Found Interesting This Week:

    • Retail Hopes Running Ahead of Reality. (WSJ)
    • As Biggest Banks Repay Bailout Money, the U.S. Sees a Profit. (NYTimes)
    • Foreign-Account Holders May Face Double Trouble Treasury & IRS.(InvestNews)
    • Wall Street’s Math Wizards Forgot a Few Variables. (NYTimes)
    • Econophysicist Predicts Date of Chinese Stock Market Collapse. (TechReview)
    • More Posts Moving the Markets.

    Lighter Ideas and Fun Links that I Found Interesting This Week

  • The Marshmallow Test: What Kids Teach Us About Temptation

    Here is a brief video that reminds me that the difference between men and boys is often just the price of their toys.

    It's fun to watch these kids and the temptation of one marshmallow in the hand vs two marshmallows in the bush.  To eat, or not to eat?  … That is the question.

    Oh, The Temptation from Steve V on Vimeo.

  • Here are the iPhone Business Apps I Use Most

    This week I'm listing the iPhone business and productivity apps that I find worth using.
    Click here to explore last week's list of the fun stuff.

    At first I wanted to create a list of the coolest iPhone apps. However, cool doesn't necessarily mean useful. Instead, this is a list of the applications that I use most. I limited myself to the top two applications per category.

    For more information about these applications, click the links to go to the developer's site.  Even if you don't have an iPhone, check-out the links to see what is
    available.  I am amazed at how much of my computing and basic research
    are now done on my phone (as opposed to laptop or desktop computers).

    Stock Market Info

    090919 iPhone Apps

    Business News

    General News

    Reference

    To-Do Lists

    Calculators

    Conversions

    Ideas

    Travel

    That's it for now.  Let me know if I forgot your favorite or you found something worth sharing.

  • Capitalogix Commentary 09/20/09

    Another week of strong performance by the markets leaves me searching for clues and signs of weakness. It's not that I don't like how the markets are reacting; because this has been a nice traders market. However, trading is about risk management and doing your best to recognize fear or greed.

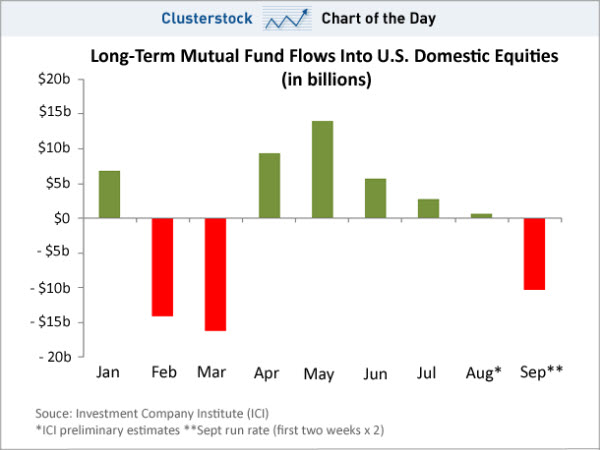
    So, one of the indicators I use to probe beneath the surface of the market is a measure of what the largest traders, Mutual Funds, are doing. There is a phrase that explains this well. Elephants leave tracks.

    090920 Mutual Fund Selling

    As you can see, while the markets continue to make new highs, Long-term mutual fund investors have reversed this month; selling shares, rather than dumping money in. Based on the first two weeks of the month, September's outflows will be bigger than the inflows seen in the last three months combined.

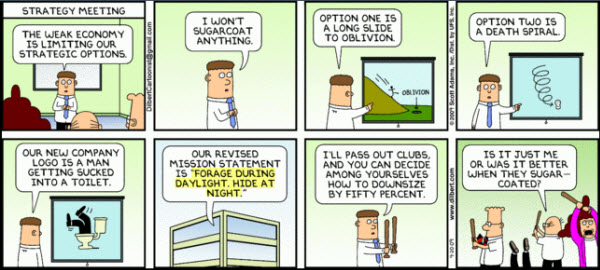
    It's not surprising that commercial traders are far less bullish than retail investors at this point of the rally.  This Dilbert cartoon sums up the way traders have been playing: "Forage during daylight and Hide at Night."

    090920 Dilbert Forage By Day and Hide at Night

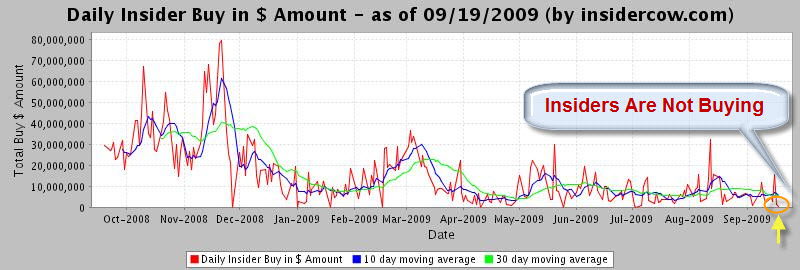
    More telling, perhaps, is that company insiders have been doing their best to sell recently. For example, in August, each dollar of insider buying was dramatically overshadowed by $30 of insider selling.  Here is a chart from Insidercow showing how bearish insiders are right now.

    090920 Insiders Selling Not Buying

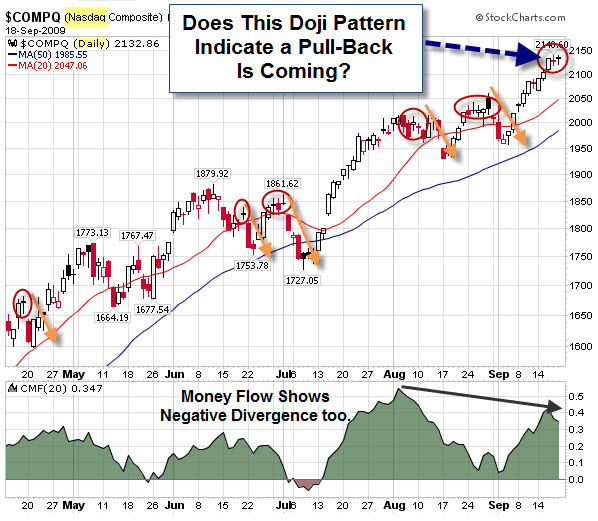
    Another indicator of indecision shown by the Japanese candlestick pattern called a Doji. It forms when the market opens and closes at approximately the same price, despite having gone higher and lower throughout the day. It indicates a fundamental disagreement between buyers and sellers, and as you can see by the chart below, often marks a reversal point.  In the daily chart of the NASDAQ, below, I marked Doji reversals.

    090920 NasdaqDoji

    None of this means that the market is going to make new lows. Instead, they're just clues. In my experience though, it's better to prepare for a storm before it hits. If it passes without incident, the planning and preparation are probably still worthwhile.

    If remember the every trade is the result of a disagreement, someone is betting that the price will go up, while someone else is betting that prices going down. Being able to see a trade from both perspectives is a good skill to develop. If you're bullish right now, use the opportunity to understand what a short seller might be seeing at this point in time. And if you're convinced the market is going down, then remember the adage don't fight the Fed and how important sentiment is. Look for areas of breakout to the upside.

    Business Posts Moving the Markets that I Found Interesting This Week:

    Lighter Ideas and Fun Links that I Found Interesting This Week