Another week of strong performance by the markets leaves me searching for clues and signs of weakness. It's not that I don't like how the markets are reacting; because this has been a nice traders market. However, trading is about risk management and doing your best to recognize fear or greed.
So, one of the indicators I use to probe beneath the surface of the market is a measure of what the largest traders, Mutual Funds, are doing. There is a phrase that explains this well. Elephants leave tracks.
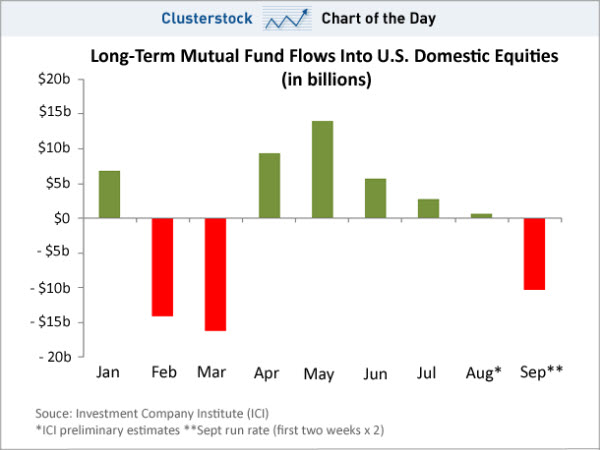
As you can see, while the markets continue to make new highs, Long-term mutual fund investors have reversed this month; selling shares, rather than dumping money in. Based on the first two weeks of the month, September's outflows will be bigger than the inflows seen in the last three months combined.
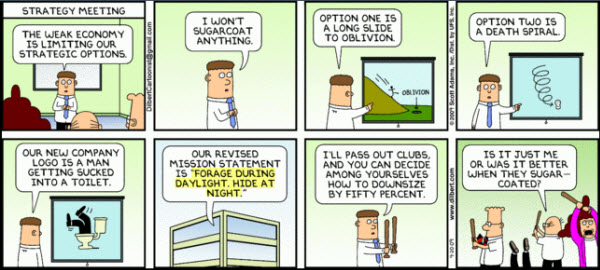
It's not surprising that commercial traders are far less bullish than retail investors at this point of the rally. This Dilbert cartoon sums up the way traders have been playing: "Forage during daylight and Hide at Night."
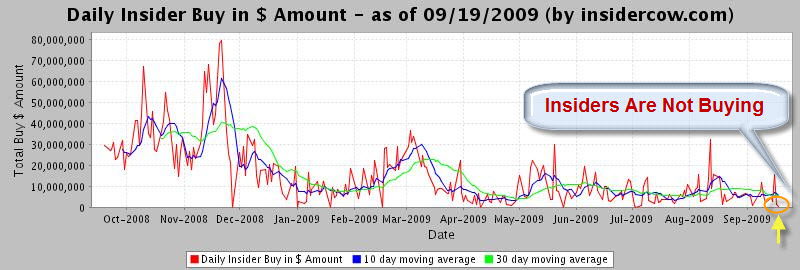
More telling, perhaps, is that company insiders have been doing their best to sell recently. For example, in August, each dollar of insider buying was dramatically overshadowed by $30 of insider selling. Here is a chart from Insidercow showing how bearish insiders are right now.
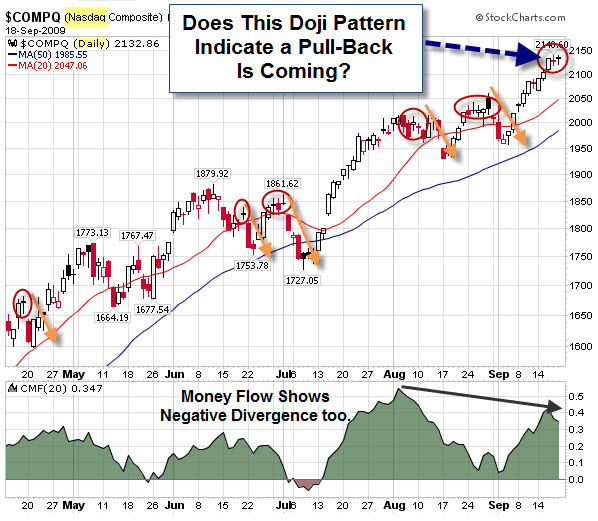
Another indicator of indecision shown by the Japanese candlestick pattern called a Doji. It forms when the market opens and closes at approximately the same price, despite having gone higher and lower throughout the day. It indicates a fundamental disagreement between buyers and sellers, and as you can see by the chart below, often marks a reversal point. In the daily chart of the NASDAQ, below, I marked Doji reversals.
None of this means that the market is going to make new lows. Instead, they're just clues. In my experience though, it's better to prepare for a storm before it hits. If it passes without incident, the planning and preparation are probably still worthwhile.
If remember the every trade is the result of a disagreement, someone is betting that the price will go up, while someone else is betting that prices going down. Being able to see a trade from both perspectives is a good skill to develop. If you're bullish right now, use the opportunity to understand what a short seller might be seeing at this point in time. And if you're convinced the market is going down, then remember the adage don't fight the Fed and how important sentiment is. Look for areas of breakout to the upside.
Capitalogix Commentary 09/20/09
Another week of strong performance by the markets leaves me searching for clues and signs of weakness. It's not that I don't like how the markets are reacting; because this has been a nice traders market. However, trading is about risk management and doing your best to recognize fear or greed.
So, one of the indicators I use to probe beneath the surface of the market is a measure of what the largest traders, Mutual Funds, are doing. There is a phrase that explains this well. Elephants leave tracks.
As you can see, while the markets continue to make new highs, Long-term mutual fund investors have reversed this month; selling shares, rather than dumping money in. Based on the first two weeks of the month, September's outflows will be bigger than the inflows seen in the last three months combined.
It's not surprising that commercial traders are far less bullish than retail investors at this point of the rally. This Dilbert cartoon sums up the way traders have been playing: "Forage during daylight and Hide at Night."
More telling, perhaps, is that company insiders have been doing their best to sell recently. For example, in August, each dollar of insider buying was dramatically overshadowed by $30 of insider selling. Here is a chart from Insidercow showing how bearish insiders are right now.
Another indicator of indecision shown by the Japanese candlestick pattern called a Doji. It forms when the market opens and closes at approximately the same price, despite having gone higher and lower throughout the day. It indicates a fundamental disagreement between buyers and sellers, and as you can see by the chart below, often marks a reversal point. In the daily chart of the NASDAQ, below, I marked Doji reversals.
If remember the every trade is the result of a disagreement, someone is betting that the price will go up, while someone else is betting that prices going down. Being able to see a trade from both perspectives is a good skill to develop. If you're bullish right now, use the opportunity to understand what a short seller might be seeing at this point in time. And if you're convinced the market is going down, then remember the adage don't fight the Fed and how important sentiment is. Look for areas of breakout to the upside.
Business Posts Moving the Markets that I Found Interesting This Week:
Lighter Ideas and Fun Links that I Found Interesting This Week
Posted at 03:08 PM in Business, Current Affairs, Market Commentary, Trading, Web/Tech | Permalink
Reblog (0)