markets around the world are breathing a little easier after a tough
last week. For example, Russia and Taiwan each lost over 10%.
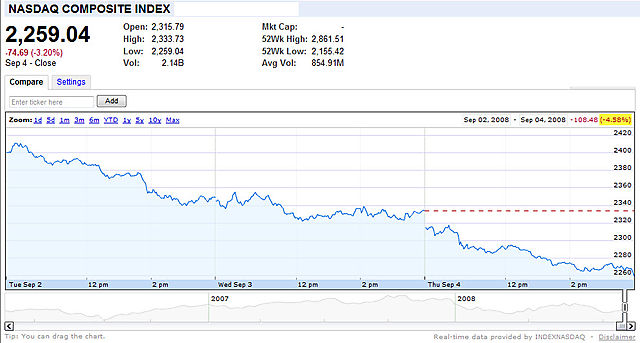
Sometimes a picture is worth a thousand words. This chart shows how the NASDAQ fared last week.

The chart doesn't need fancy indicators or words to tell the market's story: it went down.
Last week I said a move down, here, wouldn't surprise me. We got more than I expected, because it was unrelenting. After a big gap-up to start the trading week, it was straight down from there.
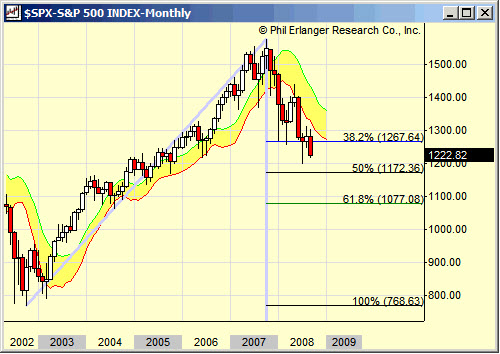
Now for the S&P 500 Index.
This chart shows the monthly displaced moving average
channel for the S&P 500 index. It typically acts as support or resistance to the markets longer trend. Notice how the attempted rally in August moved the
index closer to the channel; but the market wiped-out that
effort in just a few days of trading.
What about the Dow Jones industrial average? Which economic anxieties were the catalysts as the Dow plummeted 344.65 points on Thursday ? Was it that initial unemployment claims were near a 5-year high, the weak retail sales report, or fear of a global slow-down?
There is probably a little more work to be done on the downside, setting-up a decent bounce. Again, historical patterns show a year-end rally typically starts in late September or early October. And the 4-year Presidential cycle pattern also favors a year-end rally.
Here are a few of the posts I found interesting this week:
- U.S. Near Deal To Save Freddie and Fannie (WSJ, Washington Post)
- Another Bank Fails: 11th this year, as Regulators shut Silver State (WSJ, FDIC)
- Swing-Trading the Sell-Off (TradingMarkets via Forbes)
- Who's afraid of Sovereign Wealth Funds? (Minyanville)
- James Surowiecki on "That Uncertain Feeling" affecting the herd of investors (New Yorker)
- Unemployment hits 6.1% and a closer look doesn't make it prettier (Dash of Insight, Portfolio)
- Bank of Canada Offers a Downbeat Outlook while holding rates steady (NYTimes)
- Did governments work together to save the Dollar? (Clusterstock)
- BMW sales up 2% last month, year-over-year (Bloomberg)
- Doug Kass says this is what market bottoms look like (Street.com)
- Trader Mike says we're not oversold yet (Trader Mike)
- McCain speech seen by record number of viewers (Bloomberg)
- Apple's iPhone making gains in business users (WSJ)
- Yahoo Below $19: Microsoft's $31 Offer is Looking Pretty Good Right Now (Silicon Alley Investor)
And, a little bit extra:
- Technology That Out-thinks Us: A Partner or a Master? (NYTimes)
- Numerati: How math models improve productivity and management (BusinessWeek)
- Lines and Bubbles and Bars, Oh My! New Ways to Sift and Visualize Data (NYTimes)
- Microsoft has been granted a patent on 'Page Up' and 'Page Down' keystrokes (ZDNet)
- Invisibility Cloak becoming a reality; the challenge is seeing out of it (New Scientist, More)
- Facebook's hottest games (Forbes)
- Hulu Getting NBC Shows Before TV Does (Silicon Alley Investor)
- ESPN and Electronic Arts Innovating Play-By-Play Commentary (NYTimes)
- Google developed its own web browser called Chrome (CNet, WSJ)
- Andy Kessler's take on what Google is really doing with Chrome (Andy Kessler)
- Is the first Jerry Seinfeld ad for Microsoft funny? You decide (NextWeb)
- Download Limits: Is "all-you-can-eat" Internet a thing of the past? (ABC)


Leave a Reply