The theory is that a Super Bowl win for a team from the AFC foretells a decline in the stock market, and a win for the NFC means the stock market will rise in the coming year. So, for those who care more about markets than football, you’d be rooting for the Philadelphia Eagles.
There is one big caveat (among lots of others) ... it counts the Pittsburgh Steelers as NFC because that’s where they got their start.
If you accept that, the Super Bowl Indicator has about a 68% success rate. Sounds good, right?
Come on ... you know better.
Here are some other “fun” stock market indicators:
Rationally, we understand that football and the stock market have nothing in common. We also probably intuitively understand correlation ≠ causation. Yet, we crave order, and look for signs that make markets seem slightly more predictable.
The problem with randomness is that it can appear meaningful.
Wall Street is, unfortunately, inundated with theories that attempt to predict the performance of the stock market and the economy. The only difference between this and other theories is that we openly recognize the ridiculousness of this indicator.
More people than you would hope (or guess) attempt to forecast the market based on gut instinct, ancient wisdom, or prayers.
While hope and prayer are good things ... they aren’t good trading strategies.
As goofy as it sounds, some of these “far-fetched” theories perform better than professional money managers with immense capital, research teams, and decades of experience.
To get a better perspective, here is a thought experiment to try.
What percentage of active managers beat the S&P 500 in any given year?
... Then, what percentage beat the S&P 500 over 15 years?
The answer is that, on average, less than 33% of active managers beat the S&P in any given year. Last year, 43% beat the Index. Even more interesting is that over a 15-year period, the numbers drop much further. Depending on who is measured, only 12% of active managers and about 5% of U.S. Equity Funds beat the S&P over a 15-year period.
Here are a couple of things to consider when you evaluate those statistics. First, market statistics represent predominantly bull market periods (and underperformance tends to spike during bear markets). Second, the statistics mentioned were for professional traders and funds (and most retail traders do considerably worse than that). Third, and perhaps most importantly, the implication is that professional traders’ “intelligent” choices often turn out worse than chance. That means something they’re doing is hurting performance (rather than helping it).
Betting On The Super Bowl Champion ...
Are you trying to get rich quickly? Do you want to know if the markets will be bull or bear this year?
Look no further than the “Super Bowl Indicator”. It has to be real; the winning percentage is high, and there’s even a Wikipedia page about it.
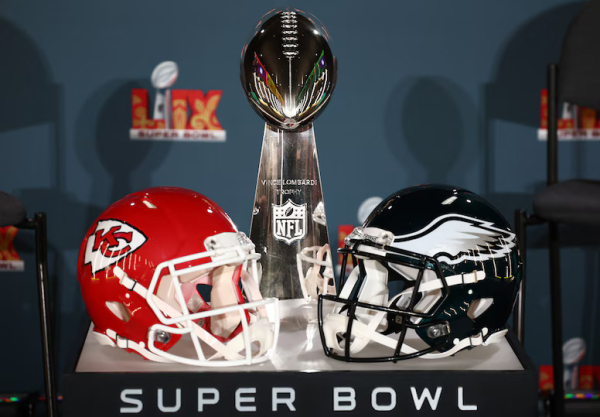
The theory is that a Super Bowl win for a team from the AFC foretells a decline in the stock market, and a win for the NFC means the stock market will rise in the coming year. So, for those who care more about markets than football, you’d be rooting for the Philadelphia Eagles.
There is one big caveat (among lots of others) ... it counts the Pittsburgh Steelers as NFC because that’s where they got their start.
If you accept that, the Super Bowl Indicator has about a 68% success rate. Sounds good, right?
Come on ... you know better.
Here are some other “fun” stock market indicators:
Back to Reality
Rationally, we understand that football and the stock market have nothing in common. We also probably intuitively understand correlation ≠ causation. Yet, we crave order, and look for signs that make markets seem slightly more predictable.
The problem with randomness is that it can appear meaningful.
Wall Street is, unfortunately, inundated with theories that attempt to predict the performance of the stock market and the economy. The only difference between this and other theories is that we openly recognize the ridiculousness of this indicator.
More people than you would hope (or guess) attempt to forecast the market based on gut instinct, ancient wisdom, or prayers.
While hope and prayer are good things ... they aren’t good trading strategies.
As goofy as it sounds, some of these “far-fetched” theories perform better than professional money managers with immense capital, research teams, and decades of experience.
To get a better perspective, here is a thought experiment to try.
What percentage of active managers beat the S&P 500 in any given year?
... Then, what percentage beat the S&P 500 over 15 years?
The answer is that, on average, less than 33% of active managers beat the S&P in any given year. Last year, 43% beat the Index. Even more interesting is that over a 15-year period, the numbers drop much further. Depending on who is measured, only 12% of active managers and about 5% of U.S. Equity Funds beat the S&P over a 15-year period.
Here are a couple of things to consider when you evaluate those statistics. First, market statistics represent predominantly bull market periods (and underperformance tends to spike during bear markets). Second, the statistics mentioned were for professional traders and funds (and most retail traders do considerably worse than that). Third, and perhaps most importantly, the implication is that professional traders’ “intelligent” choices often turn out worse than chance. That means something they’re doing is hurting performance (rather than helping it).
via Gaping Void
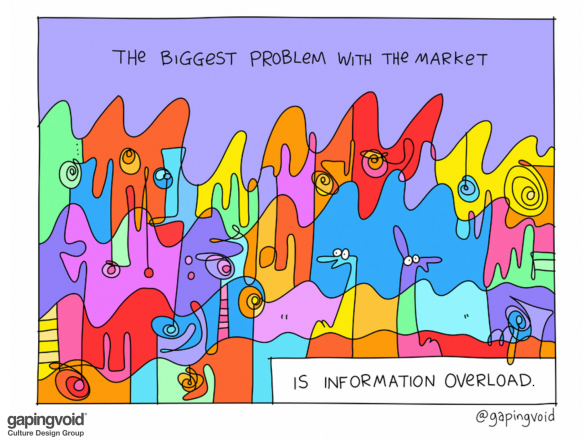
There’s simply too much information out there for us to digest, process, rank, and use appropriately.
There will never be less data or slower markets.
The only thing you can predict confidently about the markets is that volatility and noise will increase.
There are people beating the markets — not by using the Super Bowl Indicator ... they’re doing it with more algorithms and better technology.
Let me know if you want to learn more about that.
Onwards.
Posted at 06:54 PM in Business, Current Affairs, Games, Ideas, Just for Fun, Market Commentary, Science, Trading, Trading Tools | Permalink
Reblog (0)