We've just completed the first four months of trading in 2023. While the stresses of the past three years have decreased, people are still wary.
As a reminder, the S&P 500 Index ended 2022 down 18% … which was its worst performance since the financial crisis in 2008.
Visual Capitalist put together an animated visualization that covers the performance since January.
 Click to see Animated Version via Visual Capitalist.
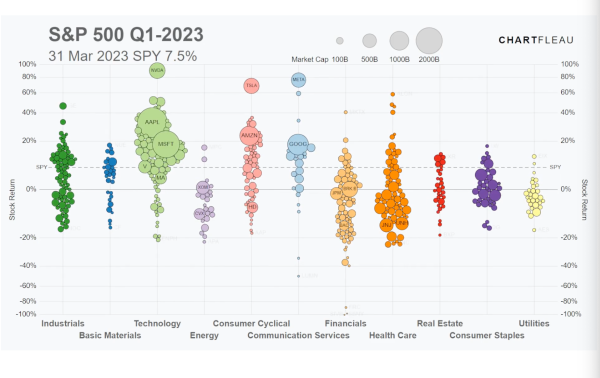
While global markets are still volatile and struggling, we are starting to see a rebound in the S&P 500. As of the date of the Visual Capitalist chart, the S&P 500 Index had increased 7.5% in Q1. While that rise was mainly driven by a few stocks, over half of the stocks in the index are above their December closing prices.
Unsurprisingly, Nvidia is topping the list in terms of performance in Q1, but it's closely followed by Meta and Tesla.
Tech has been a strong driver. As a reminder, you don't have to be a creator or user of AI to profit from it. You can also make money selling picks and shovels during the metaphorical gold rush. Nvidia is proof of that – and has capitalized heavily from the current AI boom.
On the other hand, it's not all good news, with three financial companies being the biggest losers on the S&P 500. Signature Bank, Silicon Valley Financial Group, and First Republic Bank each lost the vast majority of their value, with Signature Bank losing a whopping 99.7%. Of course, balance that with the strong performance of other financial behemoths. We're also seeing a continued drop in healthcare and consumer staples, perhaps in response to the world returning to "normal" after COVID-phobia.
It's an interesting market we're currently residing in. Investor interest is high. Yet, inflation and consumer prices reduce liquidity. There's a discrepancy between companies and consumers.
What do you think?

Leave a Reply