Tuesday is election night - so there's a lot of fear and uncertainty from both sides about the consequences.
So how do you track and understand that fear? With the CBOE's VIX.
The VIX is an index that's commonly known as the "fear gauge." It tracks how quickly asset prices move (or, in other words, their "volatility").
While you can't invest in it directly, you can invest in derivative products like VIX futures, ETFs, inverse ETFs, and more.
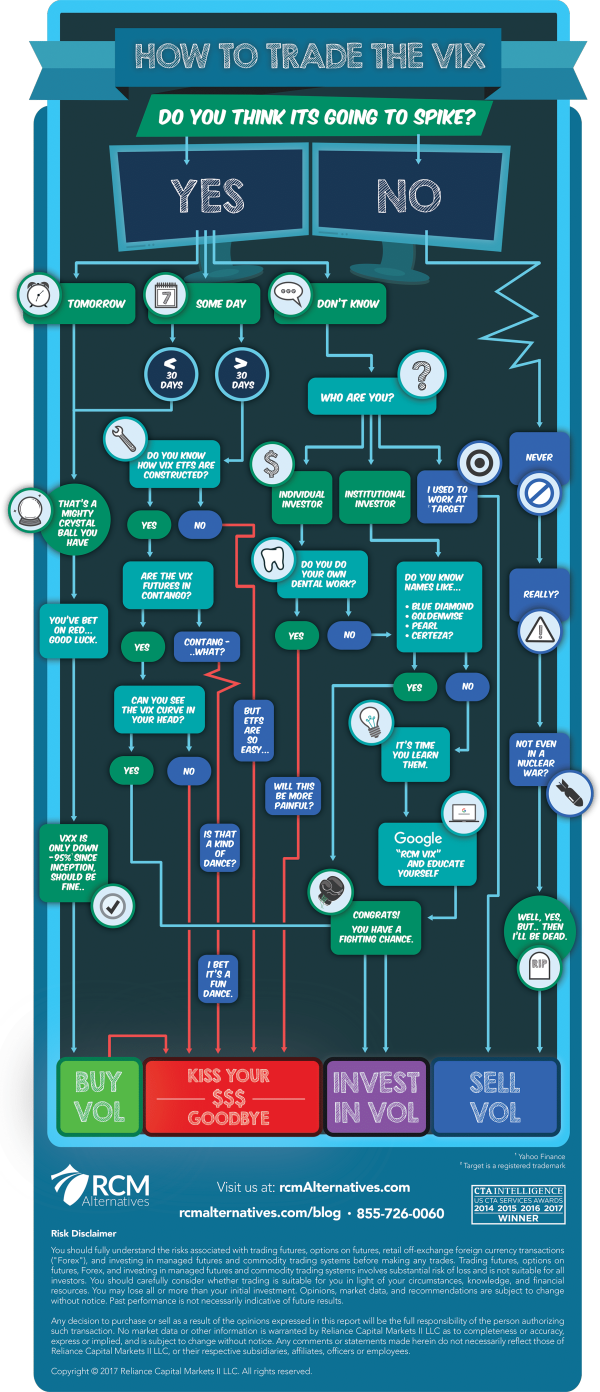
The infographic below is a good primer, and you can download RCM's full white-paper here.
Covid cases are building, the Senate didn't pass another support bill and is now adjourned until November 9th, and you have pre-election market jitters. As a result, the VIX trading volume is hitting new highs.
Overall, a higher risk environment than normal.
For context, the VIX has averaged 26.30 since August but got as high as 82.69 in March.
In the past week, after a pretty bad S&P 500 sell-off, it's gone back above 38.
There are many ways to study and use the VIX, but ultimately, tracking it in any form helps you understand the current state of fear in market participants.
I'd love to hear how you use the VIX or other tools to measure or forecast market stress and volatility.
Comments
The VIX Going Into The Election
Tuesday is election night - so there's a lot of fear and uncertainty from both sides about the consequences.
So how do you track and understand that fear? With the CBOE's VIX.
The VIX is an index that's commonly known as the "fear gauge." It tracks how quickly asset prices move (or, in other words, their "volatility").
While you can't invest in it directly, you can invest in derivative products like VIX futures, ETFs, inverse ETFs, and more.
The infographic below is a good primer, and you can download RCM's full white-paper here.
Covid cases are building, the Senate didn't pass another support bill and is now adjourned until November 9th, and you have pre-election market jitters. As a result, the VIX trading volume is hitting new highs.
Overall, a higher risk environment than normal.
For context, the VIX has averaged 26.30 since August but got as high as 82.69 in March.
In the past week, after a pretty bad S&P 500 sell-off, it's gone back above 38.
There are many ways to study and use the VIX, but ultimately, tracking it in any form helps you understand the current state of fear in market participants.
I'd love to hear how you use the VIX or other tools to measure or forecast market stress and volatility.
Posted at 06:14 PM in Business, Current Affairs, Market Commentary, Trading, Trading Tools, Web/Tech | Permalink
Reblog (0)