The calculations reflect the market cap of the S&P Global Broad Market Index which tracks more than 11,000 stocks across 50 markets. Not all-encompassing, but a good start.
To add some numbers to the chart, the US represents
73% of IT
65% of Health care
51% of Real Estate and
44% of Financials
China is closing in fast on some of these sectors, but the U.S. is still the world leader.
Comments
Dominance of the US
In light of recent fears, VisualCapitalist put together an infographic on the dominance of US companies in global sectors and industries.
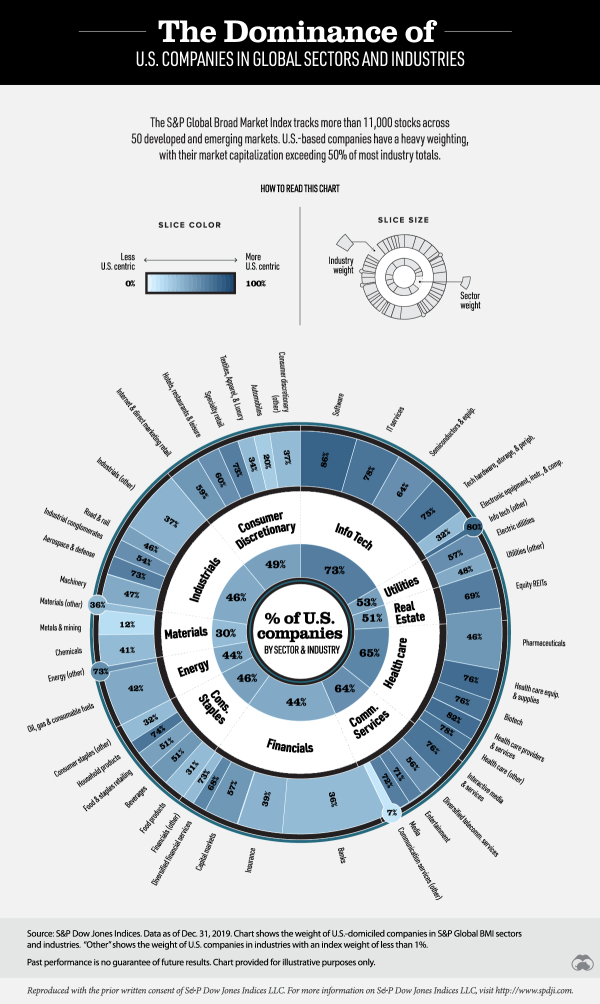
The calculations reflect the market cap of the S&P Global Broad Market Index which tracks more than 11,000 stocks across 50 markets. Not all-encompassing, but a good start.
To add some numbers to the chart, the US represents
73% of IT
65% of Health care
51% of Real Estate and
44% of Financials
China is closing in fast on some of these sectors, but the U.S. is still the world leader.
Dominance of the US
In light of recent fears, VisualCapitalist put together an infographic on the dominance of US companies in global sectors and industries.
via VisualCapitalist
The calculations reflect the market cap of the S&P Global Broad Market Index which tracks more than 11,000 stocks across 50 markets. Not all-encompassing, but a good start.
To add some numbers to the chart, the US represents
China is closing in fast on some of these sectors, but the U.S. is still the world leader.
Posted at 10:57 PM in Business, Current Affairs, Market Commentary, Trading | Permalink
Reblog (0)