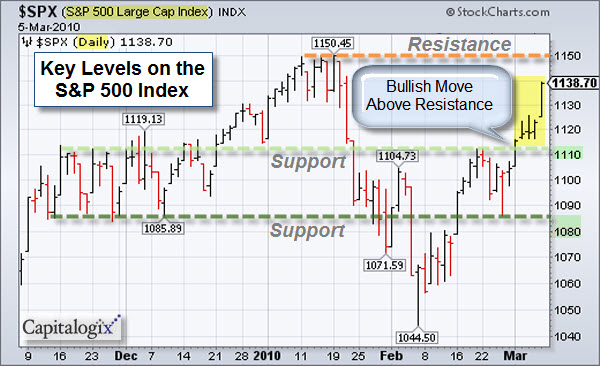
The markets put on a show of strength this week, blasting through overhead resistance. The chart below shows the S&P 500 Index is approaching its recent highs, and now has two nice levels of support beneath it (marked by the light and dark green lines).
As long as price is above these levels, it seems prudent to use
bull-market techniques. That means to expect buying on dips.
On the other hand, trading often induces paranoia. So, there is some part of me looking for the next areas that would trigger the most stop-losses. Coincidentally, this weekend I talked to a money manager who told me they were going to exit their short positions if the markets get above the recent highs (marked by the orange line). That seems like a pretty widely followed level. So, a spike above that ... followed by a sharp reversal, might find some of the selling volume we've been missing lately.
Could We Possibly Still Be in a Bear Market?
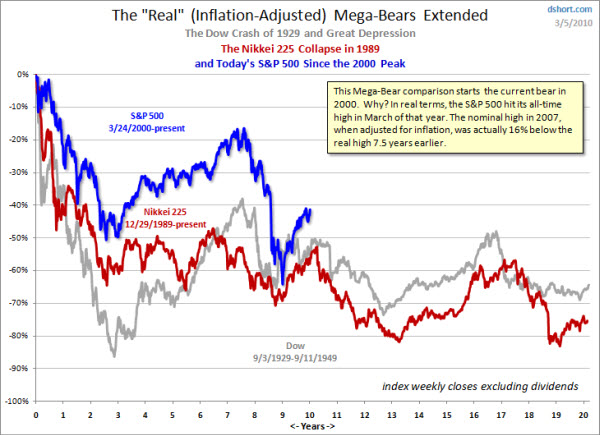
A fresh view is often helpful. The next chart is not designed to be predictive. Instead, it simply provides an alternative context to view the recent price action in relation to historic market cycles.
Below is an inflation-adjusted overlay of three secular bear markets put together by Doug Short. It aligns the current S&P 500 from the top of the Tech Bubble in March 2000, the Dow in of 1929, and the Nikkei 225 from its 1989 bubble high.
The nominal all-time high in the index occurred in October 2007, but when adjusted for inflation, the "real" all-time high for the S&P 500 occurred in March 2000.
There is a Lot of Deal-Making Going On.
Increased merger and acquisition activity and the freeing-up of corporate assets (usually measured by increased corporate spending) are both typically bullish signs. Why? Both indicate that decision-makers are optimistic (or at least projecting optimism). There's been quite a bit of evidence showing that this is happening on a global corporate scale and all the way down to the local level.
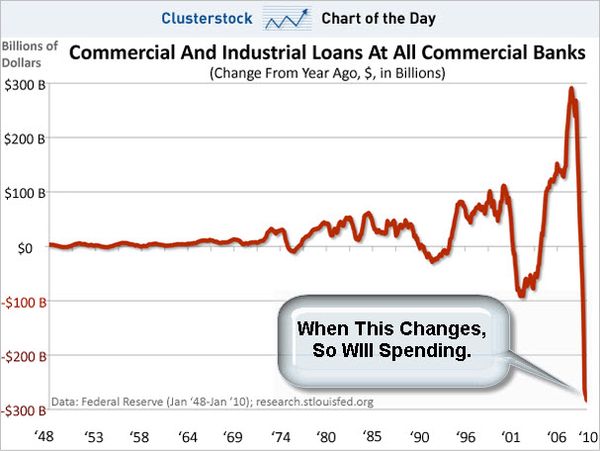
One thing holding-back the optimism is the lack of lending. Here is a look at that.
Nonetheless, companies with cash are starting to use it.
Here's a story that is a bit humorous, though still shows those green shoots of growth.
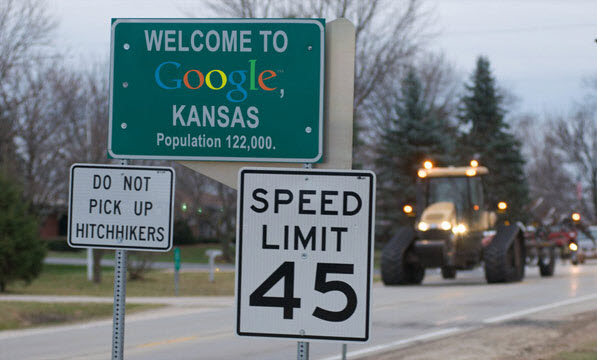
In Kansas, the city of Topeka changed its name to Google. Supposedly part of a local effort to convince Google to make Topeka a test site for an ultra-fast Internet connection and set Topeka apart from other cities vying for Google's attention.
Hope you have a good week, even if you used to live in Topeka.
Capitalogix Commentary for the Week of 03/08/10
You know Unemployment is becoming part of the cultural zeitgeist when Spider-Man gets fired.
Last week's employment report showed a fair number of other people got fired too.
Apparently, though, not many people cared, because the markets rallied anyway.
If you are interested, Barry Ritholtz put together a big picture look at employment charts.
Signs of Strength.The markets put on a show of strength this week, blasting through overhead resistance. The chart below shows the S&P 500 Index is approaching its recent highs, and now has two nice levels of support beneath it (marked by the light and dark green lines).
As long as price is above these levels, it seems prudent to use bull-market techniques. That means to expect buying on dips.
On the other hand, trading often induces paranoia. So, there is some part of me looking for the next areas that would trigger the most stop-losses. Coincidentally, this weekend I talked to a money manager who told me they were going to exit their short positions if the markets get above the recent highs (marked by the orange line). That seems like a pretty widely followed level. So, a spike above that ... followed by a sharp reversal, might find some of the selling volume we've been missing lately.
Could We Possibly Still Be in a Bear Market?
A fresh view is often helpful. The next chart is not designed to be predictive. Instead, it simply provides an alternative context to view the recent price action in relation to historic market cycles.
Below is an inflation-adjusted overlay of three secular bear markets put together by Doug Short. It aligns the current S&P 500 from the top of the Tech Bubble in March 2000, the Dow in of 1929, and the Nikkei 225 from its 1989 bubble high.
The nominal all-time high in the index occurred in October 2007, but when adjusted for inflation, the "real" all-time high for the S&P 500 occurred in March 2000.
There is a Lot of Deal-Making Going On.Increased merger and acquisition activity and the freeing-up of corporate assets (usually measured by increased corporate spending) are both typically bullish signs. Why? Both indicate that decision-makers are optimistic (or at least projecting optimism). There's been quite a bit of evidence showing that this is happening on a global corporate scale and all the way down to the local level.
One thing holding-back the optimism is the lack of lending. Here is a look at that.
Nonetheless, companies with cash are starting to use it.
Here's a story that is a bit humorous, though still shows those green shoots of growth.
In Kansas, the city of Topeka changed its name to Google. Supposedly part of a local effort to convince Google to make Topeka a test site for an ultra-fast Internet connection and set Topeka apart from other cities vying for Google's attention.
Hope you have a good week, even if you used to live in Topeka.
Business Posts Moving the Markets that I Found Interesting This Week:
Lighter Ideas and Fun Links that I Found Interesting This Week
Posted at 11:49 PM in Current Affairs, Market Commentary, Trading | Permalink
Reblog (0)