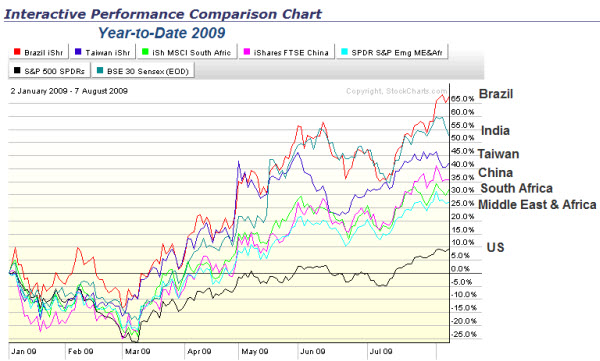
The rally continues, and the S&P 500 has gotten back above 1000. Pretty impressive on many fronts. How does it compare to other markets though? This chart shows how several other world markets have done so far in 2009.
The strength of the rallies don’t make sense to me based on logic. But trends don’t depend on logic. So, I dusted-off my copy of Trend Following and will simply ride the bucking bronco.
Why Citigroup’s Volume Is Significant.
Last week saw some interesting trading in Citigroup, as it recorded an “utterly insane” amount of volume – 2.7 BILLION – in a single day. That huge volume value caused problems throughout the financial information world. Financial systems are designed to handle certain ranges of values. If a number is outside that range, it “overflows” the data field for that value. Citigroup’s volume overflowed, which should tell you something about how likely that level of trading is to occur.
I watch volume patterns. Capitulation bottoms typically happen on huge volume spikes. I don’t know if the reverse holds true as well. But the markets are extended so I’m watching things a little more closely.
What About Gold?
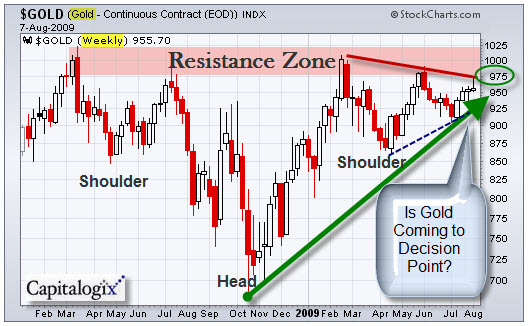
If the Markets start a deeper pull-back, then Gold looks poised for a break-out to the upside. Here is a chart showing a potential Reverse Head-and-Shoulders bottoming pattern. There recent shoulder is a triangle pattern, which indicates we should expect expanded volatility soon.
Business Posts Moving the Markets that I Found Interesting This Week:
- Can ‘Cash for Clunkers’ Help Jump-start the Auto Industry? (Wharton)
- More Stimulus: Senate Adds $2 Billion to ‘Clunkers’ Plan. (WSJ)
- Job Losses Slow to 247,000; Unemployment Rate Dips. (WPost)
- Will Apple’s iTouch Tablet Will Become Its Flagship Product? (Seeking Alpha)
- What the Hotness of Your Waitress Says About the Economy? (NY Mag)
- More Posts Moving the Markets.
Lighter Ideas and Fun Links that I Found Interesting This Week
- Google Developing An Operating System for the Cloud (TechReview)
- Did Cyber-Warfare Tactics Take Down Twitter & FB This Week? (TechChuck)
- NFL Formulating Game Day Twitter Policy (WPost)
- Protect Yourself Against Social Media Identity Hijacking. (MediaPost)
- Innovation Is A Hot Topic For Big Businesses Too. (NYTimes)
- More Posts with Lighter Ideas and Fun Links.


Leave a Reply