Earlier in the week, a number of U.S. stock indexes briefly slipped below their 50-day averages. Despite the Shut-Down, they have bullishly regained those support lines.
A key example took place in the Dow Industrials. The chart shows the Dow bouncing off initial chart support at its late August intra-day low (14760) and its 200-day average (red line). For technical traders, that is a very important test.
The sharp rally has kept the Dow above those two important support levels.
With the government shut down and the debt ceiling looming, one could argue that the U.S. economy may be on the edge of a crisis.
But the stock market is not reflecting this.
During periods of crisis and high stock market volatility, correlations among stocks increase. In other words, stocks move up and down together.
JP Morgan just published a quarterly market chartbook , which includes a useful chart tracking stock market volatility and correlations among stocks since the Great Depression.
Why? Perhaps Because Markets Tend to Go Up After Government Shutdowns.
We are in the 18th government shutdown in US history.
For some perspective, this chart plots the average S&P 500 performance for the 20 trading days (approximately one calendar month) before and 60 trading days (approximately 3 calendar months) after a government shutdown began.
The chart illustrates a bullish pattern. While the stock market has tended to struggle prior to and during the initial three days following a government shutdown ... Following this, the stock market has (on average) trended higher over the ensuing three months.
One explanation for this particular average pattern is that the market abhors uncertainty. So as the shutdown approaches, investors fear for the worst. However, after the shutdown begins and investors notice that the economy continues to function (coupled with the fact that the shutdown may be short-lived) ultimately encourages a stock market rally as investors worst fears are not realized.
It should be noted that this chart is an 'average performance chart' and that following the last 17 shutdowns, the stock market traded up 60 trading days after a shutdown on 10 out of 17 occasions (i.e. 58.8%) with the average shutdown lasting 6.4 calendar days.
Think of it as a flight to cash as retail investors dump risk assets.
The question is whether this marks the beginning of a new trend, or just nimble trading in the face of perceived danger?
Joshua Brown, who blogs under the moniker "The Reformed Broker," tries to put things in perspective with this handy guide to market pull-backs.
With less than a five percent pull-back, it is a little early to trot out words like "correction."
As to whether we could see a correction (or worse, a bear market or even a crash), the answer is that it is always possible. Nonetheless, most corrections do not become crashes, and over time, every single one of them turned out to have been great buying opportunities.
The chart below measures default risk for the major financial firms around the world. Default risk for the financials typically spikes when stocks fall and vice versa.
Throughout 2013, the credit markets have become as comfortable with financial stocks as they've been since before the financial crisis of 2008/09. During the stock market pullback we saw in June, default risk picked up a bit, but during the most recent pullback, we've seen default risk trade sideways. Over the last month, the S&P 500 Financial sector is down 4.47%, but Bespoke's CDS Index is actually down 0.45% as well. So, for whatever the reason, the credit markets don't think there's reason to be concerned just yet.
When you hear a reference to how the market is doing on the news, it is pretty common for the report to reference the performance of the Dow Jones Industrial Average. The Dow is a price-weighted measure of 30 U.S. blue-chip
companies. It covers all industries with the exception of
transportation and utilities. While this index is not as broad a representation of the US economy as the S&P 500, the Dow's performance typically tracks the S&P 500 pretty closely.
Recently, however, the blue-chip Dow has been a notable laggard compared to the broader S&P 500.
The chart below shows the relative strength of the DJIA vs. the S&P
500 over the last ten years. When the line in the chart is rising it
indicates the DJIA is outperforming, and when the line is falling the
DJIA is lagging.
As you can see, in the last several months the DJIA has been underperforming to such a large degree that the relative strength vs. the S&P 500 is at its lowest levels since the depths of the Financial Crisis.
Do you take that as a bullish sign for the broader market, or early indicator that we are in for a lull before the next move up?
Sometimes business feels like a debate. Other times, dinner conversation or a family discussion takes a contentious turn. In any case, here is a quick primer on logical fallacies.
A logical fallacy is a flaw in reasoning. In other words, logical fallacies are like tricks or illusions of thought. Consequently, they are
often used by politicians and the media.
It is fun to identify which of these certain people (including yourself) use when arguing.
TWENTY LOGICAL FALLACIES:
They fall into three main types: Distraction (10); Ambiguity (5); and Form (5).
A. Fallacies of Distraction
1. Ad baculum (Veiled threat): "to the stick": DEF.- threatening an opponent if they don’t agree with you; EX.- "If you don’t agree with me you’ll get hurt!"
2. Ad hominem (Name-calling; Poisoning the well): "to the man": DEF.- attacking a person’s habits, personality, morality or character; EX.- "His argument must be false because he swears and has bad breath."
3. Ad ignorantium (Appeal to ignorance): DEF.- arguing that if something hasn’t been proved false, then it must be true; EX.- "U.F.Os must exist, because no one can prove that they don’t."
4. Ad populum: "To the people; To the masses": DEF.- appealing to emotions and/or prejudices; EX.- "Everyone else thinks so, so it must be true."
5. Bulverism: (C.S. Lewis’ imaginary character, Ezekiel Bulver) DEF.- attacking a person’s identity/race/gender/religion; EX.- "You think that because you’re a (man/woman/Black/White/Catholic/Baptist, etc.)"
6. Chronological Snobbery DEF.- appealing to the age of something as proof of its truth or validity; EX.-"Voodoo magic must work because it’s such an old practice;" "Super-Glue must be a good product because it’s so new."
7. Ipse dixit: "He said it himself": DEF.- appealing to an illegitimate authority; EX.- "It must be true, because (so and so) said so."
8. Red herring (Changing the subject): DEF.- diverting attention; changing the subject to avoid the point of the argument; EX.- "I can’t be guilty of cheating. Look how many people like me!"
9. Straw Man: DEF.- setting up a false image of the opponent's argument; exaggerating or simplifying the argument and refuting that weakened form of the argument; EX.- "Einstein's theory must be false! It makes everything relative--even truth!"
10. Tu quoque: "You also" DEF.- defending yourself by attacking the opponent; EX.- "Who are you to condemn me! You do it too!"
B. Fallacies of Ambiguity
1. Accent: DEF.- confusing the argument by changing the emphasis in the sentence; EX.- "YOU shouldn’t steal" (but it’s okay if SOMEONE ELSE does); "You shouldn’t STEAL" (but it’s okay to LIE once in a while); "You SHOULDN’T steal (but sometimes you HAVE TO) ."
2. Amphiboly: [Greek: "to throw both ways"] DEF.- confusing an argument by the grammar of the sentence; EX.- "Croesus, you will destroy a great kingdom!" (your own!)
3. Composition: DEF.- assuming that what is true of the parts must be true of the whole; EX.- "Chlorine is a poison; sodium is a poison; so NaCl must be a poison too;" "Micro-evolution is true [change within species]; so macro-evolution must be true too [change between species]."
4. Division: DEF.- assuming that what is true of whole must be true of the parts; EX.- "The Lakers are a great team, so every player must be great too."
5. Equivocation: DEF.- confusing the argument by using words with more than one definition; EX.- "You are really hot on the computer, so you’d better go cool off."
C. Fallacies of Form
1. Apriorism (Hasty generalization): DEF.- leaping from one experience to a general conclusion; EX.- "Willy was rude to me. Boys are so mean!"
2. Complex question (Loaded question): DEF.- framing the question so as to force a single answer; EX.- "Have you stopped beating your wife yet?"
3. Either/or (False dilemma): DEF.- limiting the possible answers to only two; oversimplification; EX.- "If you think that, you must be either stupid or half-asleep."
4. Petitio principii (Begging the question; Circular reasoning): DEF.- assuming what must be proven; EX.- "Rock music is better than classical music because classical music is not as good."
5. Post hoc ergo propter hoc (False cause): "after this, therefore because of this;" DEF.- assuming that a temporal sequence proves a causal relationship; EX.- "I saw a great movie before my test; that must be why I did so well."
According to SentimenTrader, extremes in
hedgers' positions in the futures have been good clues to the future
prospect for stocks in the intermediate-term.
For example, the chart below shows that there were heavy short positions last September, immediately
preceding a correction. In addition, there was a near net long position last November,
immediately preceding a rally. Finally, look at the record net short in
May right before another rough few weeks for stocks.
Obviously, we are close to those levels again.
Neither of the recent record short positions by commercials marked a major market peak. At its worst point during the next 4-8 weeks, the S&P 500 lost 4% - 6% before recovering ... painful but not damaging.
Still, it is prudent to notice these kind of early indicators. However, remember that the trend has been bullish recently. Price is the primary indicator, and until it breaks down, expect dips to be met with buying.
This chart displays the price of the Dow going all the way back to 1885 -- and adjusts it for inflation. Clearly, if you do that, it is lower now than it was 13-years ago.
But, does the series of lower highs (marked at the far right of the chart) imply a meaningful technical analysis resistance level? Moreover, can you safely infer that the Dow is 'struggling' with that level? I don't think so.
Technical analysis is supposed to help you understand, and respond intelligently, to what is happening in the market. This pattern seems more coincidental, rather than causal.
Support and resistance zones supposedly reflect meaningful price points where a genuine disagreement between the Bulls and Bears is contested. I doubt this pattern was caused by Traders making big bets based on inflation-adjusted charts.
Consequently, I view this as interesting, but not tradeable, information ... What about you?
How high is high? Here's a comparison based on historical PE ratios.
Most country equity valuations are trading at their 10-year average valuation or lower. However, a few countries like Mexico, Sweden, Switzerland, and the United States are trading at levels above their respective 10-year valuations.
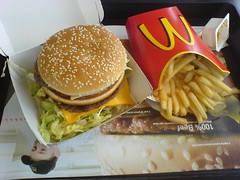
The Economist's Big Mac index seeks to make exchange-rate theory more digestible. They say it is arguably the world's most accurate financial indicator to be based on a fast-food item.
The Big Mac index is based on the theory of purchasing-power parity (PPP), according to which exchange rates should adjust to equalize the price of a basket of goods and services around the world. For them, the basket is a burger ... a McDonald’s Big Mac.
According to this measure, the most undervalued currency is India's Rupee at 67% below its PPP rate. In India, a McDonald’s Big Mac costs just 90 Rupees on average, the equivalent of $1.50 at market exchange rates.
In America, the same burger averages $4.56.
The interactive graphic, below, shows by how much, in Big Mac PPP terms, selected currencies were over- or undervalued.
The index is supposed to give a guide to the direction in which
currencies should, in theory, head in the long run. It is only a rough
guide, because its price reflects non-tradable elements such as rent
and labor. For that reason, it is probably least rough when comparing
countries at roughly the same stage of development.


Dow Jones Industrials Still Trading Above Key Support Levels
This week, the Dow Industrials bounced-off its 200-day moving average and technical traders relaxed a little.
Earlier in the week, a number of U.S. stock indexes briefly slipped below their 50-day averages. Despite the Shut-Down, they have bullishly regained those support lines.
A key example took place in the Dow Industrials. The chart shows the Dow bouncing off initial chart support at its late August intra-day low (14760) and its 200-day average (red line). For technical traders, that is a very important test.
The sharp rally has kept the Dow above those two important support levels.
Posted at 04:31 PM in Current Affairs, Market Commentary, Trading, Trading Tools | Permalink | Comments (0) | TrackBack (0)
Reblog (0)