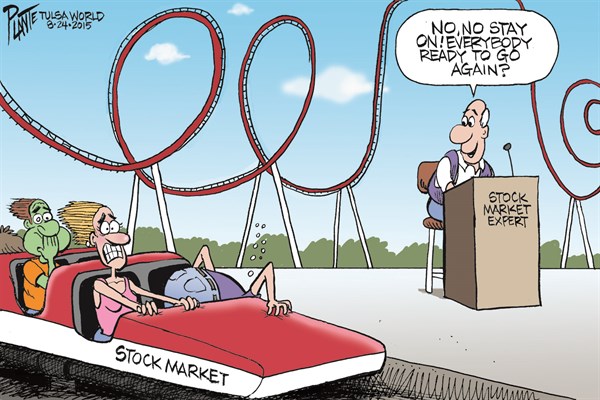
Oh good ... The Markets went up on Friday. Everything must be back to normal.
Here are some of the posts that caught my eye. Hope you find something interesting.
- Ten Tech Predictions for 2016. (Re/code)
- Which Big Tech Firm Won the Most Patents in 2015? (Fortune)
- The Theory of Everything - And Then Some. (Slate)
- 36 Pictures to See Which Muscle You’re Stretching. (MYLH)
- The Reason Why Some Men Like Big Boobs, According to Science. (Details)
- Why Bank of America Just Said To Go Long "Cash & Volatility", in Charts. (ZeroHedge)
- America’s Best Forecaster — Again and Again. (MarketWatch)
- FinTech Stalking Wall Street. (DealBreaker)
- Beware: IRS Now Has Six Years To Audit Your Taxes, Up From Three. (Forbes)
- By 2050, There Will Be Nearly 10 Billion People on Earth, But Just 13% Will Be in High-Income Countries. (WSJ)
Is a Leading Indicator of Economic Activity Drying-Up?
People are afraid abandoned 'zombie ships' are an early sign of global economic collapse.
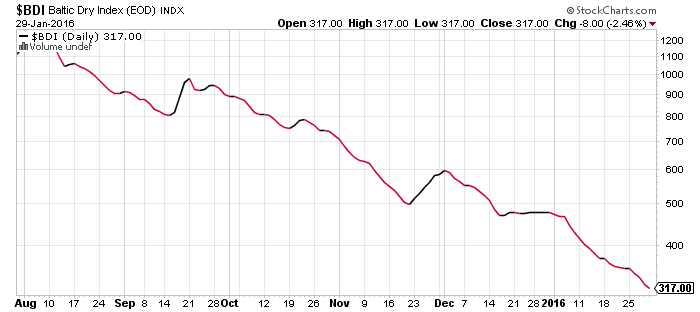
If you are looking for insight into global supply and demand trends, the Baltic Dry Index is one of the purest leading indicators of economic activity. It offers a real-time glimpse at global raw material and infrastructure demand, as well as the supply of ships available to move this type of cargo.
Unfortunately, it is sinking faster than a ship.
via StockCharts.com
The low is troubling because this Index is often interpreted as a reliable indicator of demand.
The Index moved higher from 2003 to 2008. Since then, we have seen a series of lower highs and lower lows (in other words, it has been trending downwards since then).
Posted at 04:47 PM in Business, Current Affairs, Market Commentary, Trading, Trading Tools | Permalink | Comments (0)
Reblog (0)