Capitalogix Commentary 11/22/10 - Smart versus Dumb Money
Market Commentary
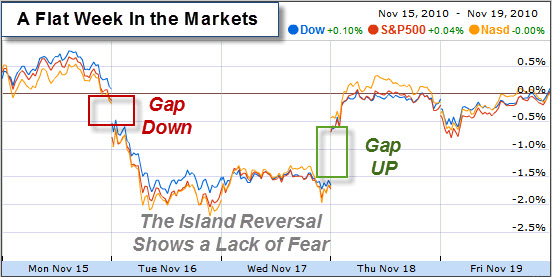
A flat market doesn't mean that nothing happened. Last week may have started and ended in about the same place; however, the market showed a lot of resilience.
Where Did The Fear Go?
The lack of fear and the lack of selling pressure is surprising to me. On one hand, that is a bullish sign. On the other hand, sentiment is often a contrary indicator.
One well known measure is the Chicago Board Options Exchange Volatility Index (commonly referred to as the VIX), a measure of fear and how much investors are willing to pay for options as protection against declines in their portfolios, has drifted down to levels that were coincident with short-term market tops in April 2010 and a series of tops in 2007 and 2008.
In addition, the latest report by Investors Intelligence measuring the sentiment of investment newsletters, shows 56.2% are bullish, while only 20.2% are bearish. This is the highest level of bullishness since December, 2007 (which was just a couple of months after the severe 2007-2009 bear market began).
Likewise, the weekly poll of its members by the American Association of Individual Investors, showed sentiment had reached 57.6% bullish last week, its highest level in a number of years, higher than just before the 2007 bull market top (54.6% bullish), higher than just before the top in January of this year (49.2%) and higher than just before the April top (48.5% bullish).
It plunged to only 40.0% bullish this week, which had some pundits saying, "Ah, that removes the risk from the investor sentiment side." But, according to Sy Harding, unfortunately that's not how it usually works.
The chart, below, compares the bets made by small traders (a.k.a. the "Dumb Money"), to those of large commercial hedgers (a.k.a. the "Smart Money").
In practice, Confidence Index readings rarely get below 30% or above 70% (they usually stay between 40% and 60%). When they move outside of those bands, it's time to pay attention.
Even more noteworthy is when there is a wide confidence spread with bullish bets by the Dumb Money and bearish bets by the Smart Money. This type of sentiment spread only happens a few times a year. We often get substantial bullish reversals when that happens.
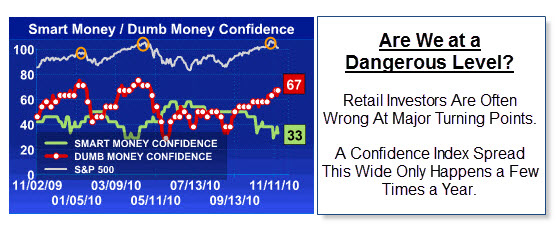
Conventional trading wisdom says that Crowds are usually wrong at turning-points. That doesn't mean they are wrong all the time (yet I take special notice when the Smart Money clearly disagrees).
Capitalogix Commentary 11/22/10 - Smart versus Dumb Money
Market Commentary
A flat market doesn't mean that nothing happened. Last week may have started and ended in about the same place; however, the market showed a lot of resilience.
Where Did The Fear Go?
The lack of fear and the lack of selling pressure is surprising to me. On one hand, that is a bullish sign. On the other hand, sentiment is often a contrary indicator.
One well known measure is the Chicago Board Options Exchange Volatility Index (commonly referred to as the VIX), a measure of fear and how much investors are willing to pay for options as protection against declines in their portfolios, has drifted down to levels that were coincident with short-term market tops in April 2010 and a series of tops in 2007 and 2008.
In addition, the latest report by Investors Intelligence measuring the sentiment of investment newsletters, shows 56.2% are bullish, while only 20.2% are bearish. This is the highest level of bullishness since December, 2007 (which was just a couple of months after the severe 2007-2009 bear market began).
Likewise, the weekly poll of its members by the American Association of Individual Investors, showed sentiment had reached 57.6% bullish last week, its highest level in a number of years, higher than just before the 2007 bull market top (54.6% bullish), higher than just before the top in January of this year (49.2%) and higher than just before the April top (48.5% bullish).
It plunged to only 40.0% bullish this week, which had some pundits saying, "Ah, that removes the risk from the investor sentiment side." But, according to Sy Harding, unfortunately that's not how it usually works.
Smart Money - Dumb Money Confidence Index.
The chart, below, compares the bets made by small traders (a.k.a. the "Dumb Money"), to those of large commercial hedgers (a.k.a. the "Smart Money").
In practice, Confidence Index readings rarely get below 30% or above 70% (they usually stay between 40% and 60%). When they move outside of those bands, it's time to pay attention.
Even more noteworthy is when there is a wide confidence spread with bullish bets by the Dumb Money and bearish bets by the Smart Money. This type of sentiment spread only happens a few times a year. We often get substantial bullish reversals when that happens.
Conventional trading wisdom says that Crowds are usually wrong at turning-points. That doesn't mean they are wrong all the time (yet I take special notice when the Smart Money clearly disagrees).
Business Posts Moving the Markets that I Found Interesting This Week:
Lighter Ideas and Fun Links that I Found Interesting This Week
Posted at 11:27 PM in Current Affairs, Market Commentary, Trading | Permalink
Reblog (0)