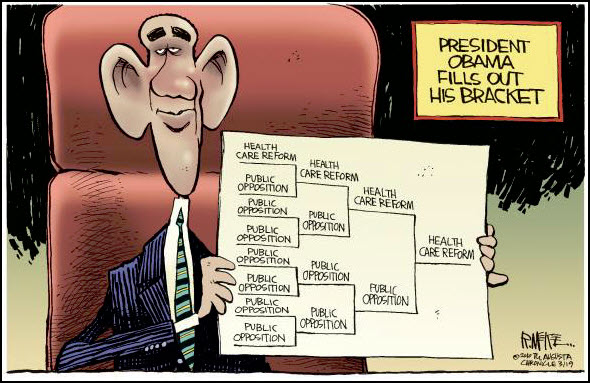
March Madness is in full force. What's a $ Trillion here, or a $ Trillion there?
A Look at the Markets.
Most people consider it "bullish" when markets go up 14 of 16 days. That should make people happy, right?
Recently, though, I've had conversations with several "old-pro" traders who expressed a sense of frustration. They view the recent push higher with skepticism. Trading discipline is allowing them to make money on the upside, but it's not as satisfying as being "right".
What do the Charts Show?
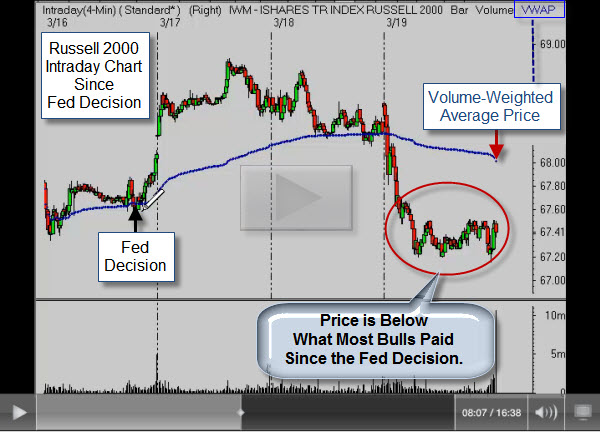
Let's look beyond the obvious up-trend. The following chart and video, from Brian Shannon's Alphatrends site, shows that price is now below the volume-weighted average price paid since Fed Decision to leave rates unchanged.
There is now a lot of support under our recent highs, so many expect the market to correct a little, then resume its move higher.
How Far Can the Rally Go?
On a basic level, the recent market rally shows that there's more buying
demand than selling pressure. However, when there is little selling
pressure, it doesn't take much demand to keep prices going higher.
At this point, the rally has gone on long enough that many of the participants who profited
from the extended move up are now becoming defensive.
Also, some trading
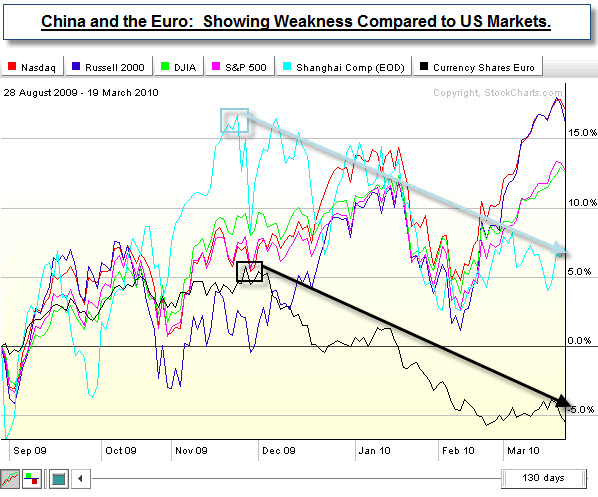
relationships that tend to move together have decoupled. The following
chart shows the recent weakness of the China Shanghai Index and the Euro
in comparison to the U.S. Markets.
Some see the U.S. Market's continued relative strength as a precursor to a new leg of the bull market, while
others see it as a temporary anomaly.
Adding to the bearish case is that several sentiment indicators show
very little fear. The VIX
is moving back to the extreme levels of complacency. Odd-lot shorts
recorded a 13 week low, indicating that the "little guy" has virtually
given up on shorting. Likewise, the lack of fear is downright scary when
you look at CBOE's
Equity Put-to-Call
Ratio. These readings are contrary indicators, meaning they often occur at
turning points in the market.
And with quad-witching
expiration behind us, and an unpopular health-care issue in
the news, the bears will have another chance to show their conviction ... or lack of it.
We'll see what happens. I hope you have a good week.
Capitalogix Commentary for the Week of 03/22/10
March Madness is in full force. What's a $ Trillion here, or a $ Trillion there?
A Look at the Markets.
Most people consider it "bullish" when markets go up 14 of 16 days. That should make people happy, right?
Recently, though, I've had conversations with several "old-pro" traders who expressed a sense of frustration. They view the recent push higher with skepticism. Trading discipline is allowing them to make money on the upside, but it's not as satisfying as being "right".
What do the Charts Show?
Let's look beyond the obvious up-trend. The following chart and video, from Brian Shannon's Alphatrends site, shows that price is now below the volume-weighted average price paid since Fed Decision to leave rates unchanged.
How Far Can the Rally Go?
On a basic level, the recent market rally shows that there's more buying demand than selling pressure. However, when there is little selling pressure, it doesn't take much demand to keep prices going higher.
At this point, the rally has gone on long enough that many of the participants who profited from the extended move up are now becoming defensive.
Also, some trading relationships that tend to move together have decoupled. The following chart shows the recent weakness of the China Shanghai Index and the Euro in comparison to the U.S. Markets.Some see the U.S. Market's continued relative strength as a precursor to a new leg of the bull market, while others see it as a temporary anomaly.
Adding to the bearish case is that several sentiment indicators show very little fear. The VIX is moving back to the extreme levels of complacency. Odd-lot shorts recorded a 13 week low, indicating that the "little guy" has virtually given up on shorting. Likewise, the lack of fear is downright scary when you look at CBOE's Equity Put-to-Call Ratio. These readings are contrary indicators, meaning they often occur at turning points in the market.
And with quad-witching expiration behind us, and an unpopular health-care issue in the news, the bears will have another chance to show their conviction ... or lack of it.
We'll see what happens. I hope you have a good week.
Business Posts Moving the Markets that I Found Interesting This Week:
Lighter Ideas and Fun Links that I Found Interesting This Week
Posted at 07:02 PM in Current Affairs, Market Commentary, Trading | Permalink
Reblog (0)