Great market action for bulls recently. If this has been a head-fake, it certainly was a convincing one.
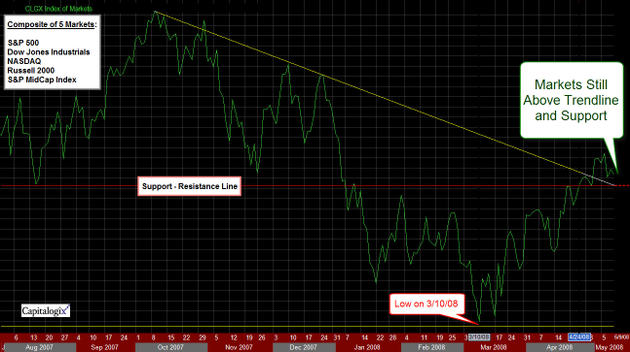
The major US Equity Indices are all moving up to their 2008 highs – into their 200-day moving averages.
There has been a prolonged rally off the March lows, so you are going to hear lots of bearish predictors. It makes sense from the standpoint of price, time and logic.
Right?
For example:
- We are now "overbought" and the rally is approaching the 61.8% Fibonacci Retracement level;
- A re-test of the 50-Day moving average is a likely next move;
- That the Put/Call ratio is too bullish, and so is dumb-money confidence levels;
- The VIX is simply too low, and readings at these levels often precede big drops;
- Consumer confidence levels are at dangerously low levels (add inflation, housing, and gas …); and
- We are still in that range-bound congestion area, and the longer we stay here the more we spend upside momentum.
But, you have to trade what the market brings you. And the market has digested bad news well recently. More importantly, we know that markets don’t have to trade logically. So keep your eyes open and respond intelligently.
Here are some of the things I read this week.
-
Hulbert sees several bullish indicators; here are two: Fosback’s Recession Buy Indicator and
Best Market-Timers Now Bullish. - Good look at how breadth is supporting the recent rally in How to Gauge Market Strength.
- Bernanke is looking into what causes market manias in his Bubble Laboratory.
- Barrons had a nice piece on Doug Kass called Confessions of a Short Seller.
- Have you seen the video of Bill O’Reilly throwing a temper tantrum.


