I'm launching a new newsletter - with a twist. The newsletter will be fully automated and produced by an AI we are training to pick out the articles to highlight and share.
Don't Let the Past Get In the Way of the New.
Even though a lot of what I think and write about is innovation, exponential technologies, and automation ... until now, what we write and send has been the result of human effort rather than artificial intelligence or technology.
Sure, portions of the process leverage technology ... but humans have written the vast majority of what you read here.
It takes many hours a week. Frankly, many more hours than you would guess!
Still, I enjoy working on the Weekly Commentary and the list of links that I share. It is a labor of love (or OCD?) that I have been producing for about twenty years!
If you aren't a subscriber yet, please click here to get it!
We currently send out two weekly e-mails. The one that comes out on Fridays is a hand-curated list of links that I found interesting during the week. The Sunday edition has two articles written by me and my son, Zach, along with a few more links.
Deep down, I know that AI is now good enough to curate a high-quality list of articles in a more efficient, effective, and certain way than what I produce.
So, we are about a week away from launching this.
This is my John Henry Versus The Machine.
And I'll tell you what – I'm worried.
The new AI-generated newsletter is really good.
Why Play a Losing Game?
I know that I will lose ... But I also know that I will win. And so will you!
This does not have to be an "either-or" decision. This is a "both-and" decision. Meaning ... I don't have to decide whether to stop producing by hand, in order to also produce with AI.
One of the challenges with AI is that the fitness function you choose significantly impacts the result you achieve.
If the purpose of the newsletter was only to produce a quality newsletter in less time, with less effort, and with greater certainty that readers engage ... then the result is inevitable. The AI newsletter wins.
However, I didn't choose to produce the newsletter for the newsletter. The newsletter is a natural result of my nature. I did the research because I wanted to do the research.
I am naturally curious and passionate about these things. It's what I think about. It's who I am ... and what I do.
The Weekly Commentary and Link List are strategic byproducts of something that I'm going to choose to do anyway,
AI Won't Replace the Real Magic.
One of my beliefs about AI is that you shouldn't use it to replace your Unique Ability. In other words, don't try to automate, delegate, or outsource something you are great at, if it gives you energy. The goal is to magnify "magic," not replace it. The goal is to spotlight and support those areas by taking away things that are frustrating, bothersome, distracting, or taking cycles away from something that would produce a greater result with less energy.
The point is, I can do both. I will still do research because it gives me pleasure, knowledge, and a greater likelihood of continuing to learn and grow. I will continue to write and curate.
Why? Because it's also an important part of my thinking process. I think when I speak. I think when I write. But more importantly, I think when I am preparing to speak or write. I wouldn't be me if I didn't go through that process. I also don't believe my ideas or opinions would continue evolving without the challenge and effort.
And I will also enjoy evolving new and different channels of communication.
Hopefully, we all benefit.
So, I hope you sign up for the new newsletter. We'll be sending out the first e-mail within the next week or two.
As I've said, I love writing and researching. I'm an innovator at heart.
Many read my articles because of my commitment to AI, new technologies, and the future. Most of my exploration has been centered on Capitalogix and our Amplified Intelligence Platform. But there are a lot of exciting new use cases of AI, and I'm exploring many of those apps right now.
For example, as you could have guessed, one such use that I'm excited about is AI-curated newsletters. Many people I trust and respect have started using Daily.AI, including Peter Diamandis, Dan Sullivan, Joe Polish, and Chris Voss. It's clearly a successful modality.
A Thousand Mile Journey Starts With a Single Step.
Hopefully, you are excited about the new newsletter and the value you will get from it.
I'm confident it will only improve – because it learns from what you value.
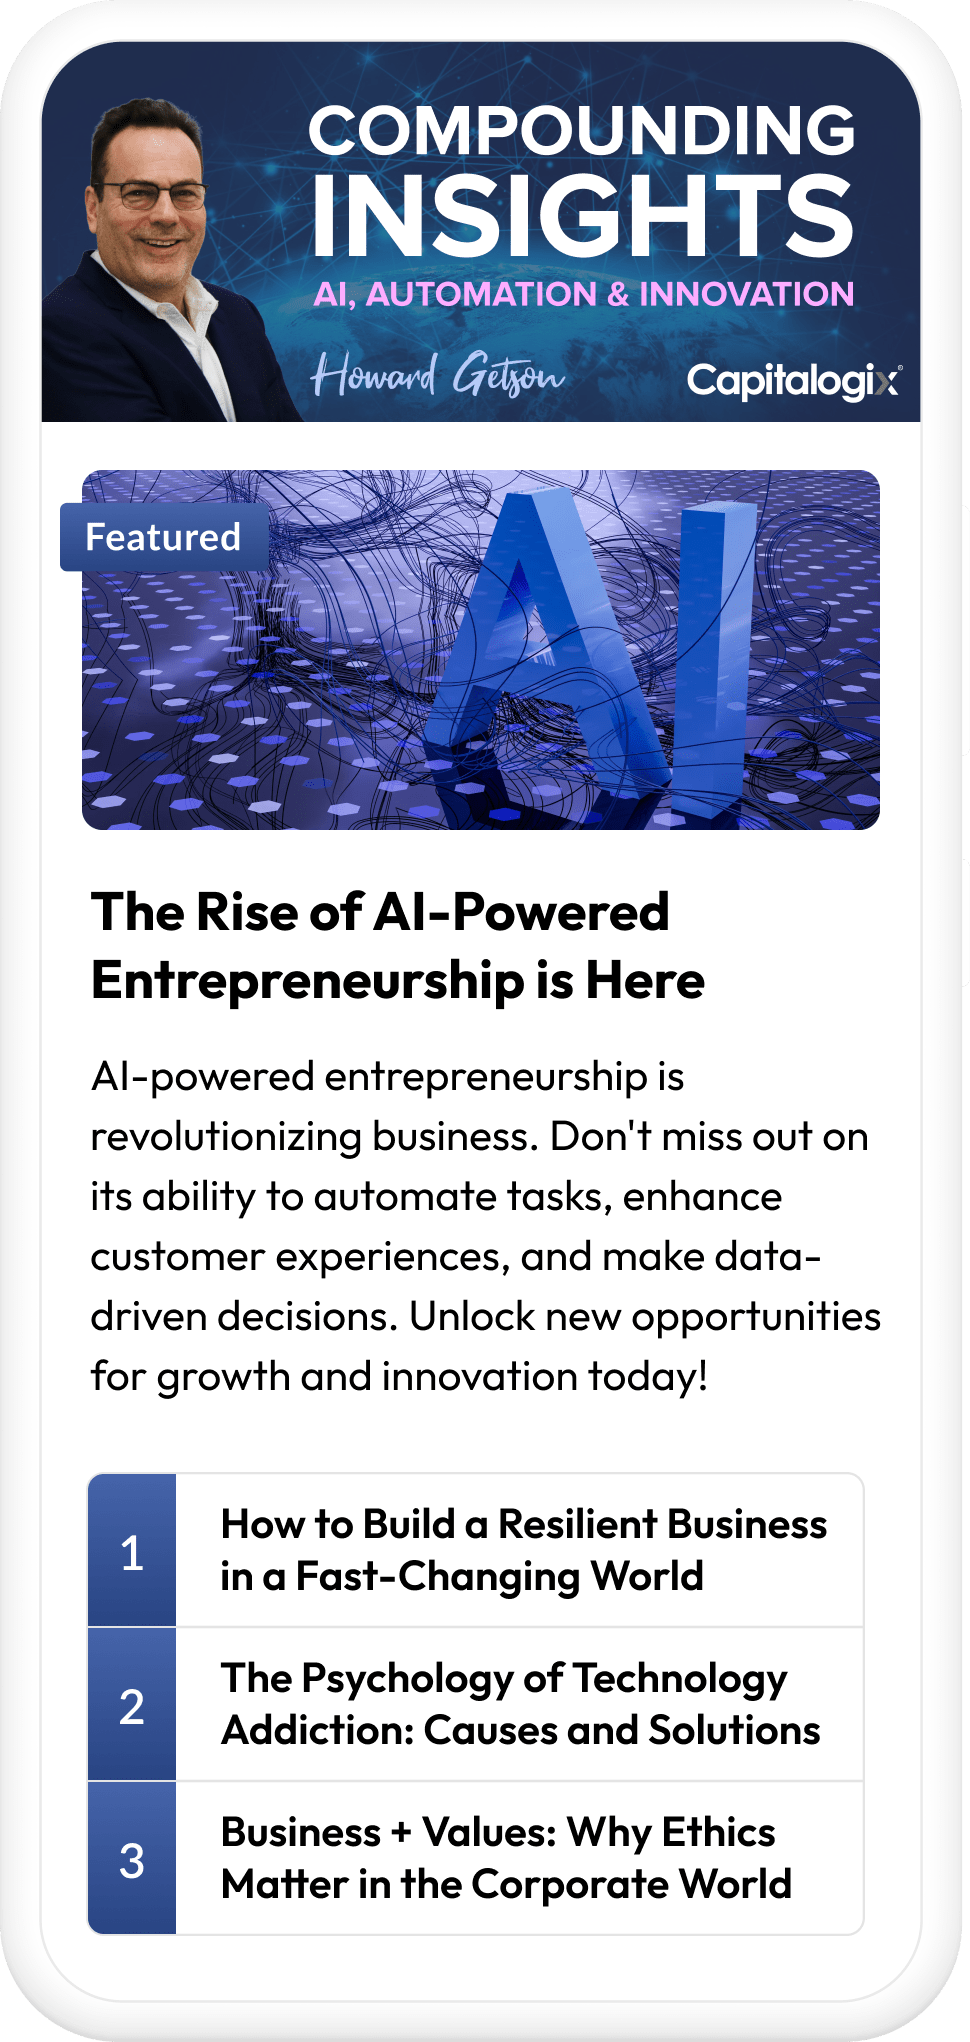
To start, the newsletter will focus on these three topic areas:
- How to build a resilient business in a fast-changing world
- The Psychology of technology & technology addiction
- Business ethics and AI ethics in today's world.
But that is just the starting point. It is set up to consider the same type of offshoots as I normally would. So, it will remain diverse and educational.

Social Media Is Changing Everything ... 10+ Years Later
In 2009, I wrote an article highlighting the audacious amount of texts and data my then-16-year-old son was using compared to the rest of the family ... It's funny to look back on.
Here is an excerpt from that post.
_______
_______
Fourteen years later, I send more text messages than my son, and we both use multiples of that amount of data a month.
I also remember scoffing at my son having his phone on hand at meetings - that it was a distraction. And yet, here I am, phone on my desk at meetings. But, e-mail is just as important as it was in 2009.
One of the things we miss in discussions about generations is that the trends of the younger generation are often adopted by the previous - even if they're not as tech literate.
Technology changes cultures for better or worse ... but it's hard to look at the impact of social media and believe it hasn't been deleterious.
The promise and peril of technology!
Posted at 03:44 PM in Business, Current Affairs, Film, Gadgets, Healthy Lifestyle, Ideas, Just for Fun, Market Commentary, Personal Development, Science, Web/Tech | Permalink | Comments (0)
Reblog (0)