November 2009

  • Capitalogix Commentary 11/08/09

    The best thing I can say about the market is that the current lack of sellers is giving investors a good long chance to take their bullish bets off the table.

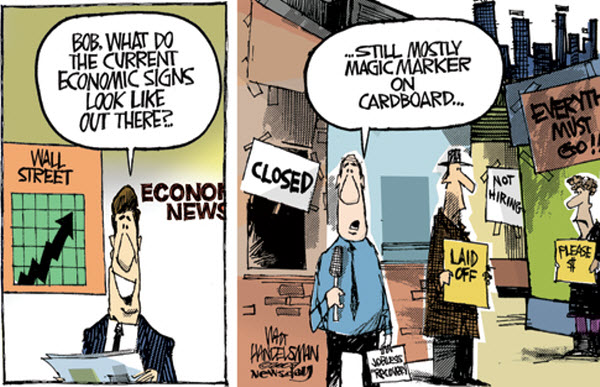
    Unemployment is above 10%, and at its highest level since 1983.  Here are a few economic signs.

    091108 Economic Signs Written on Cardboard
    What about the Market?

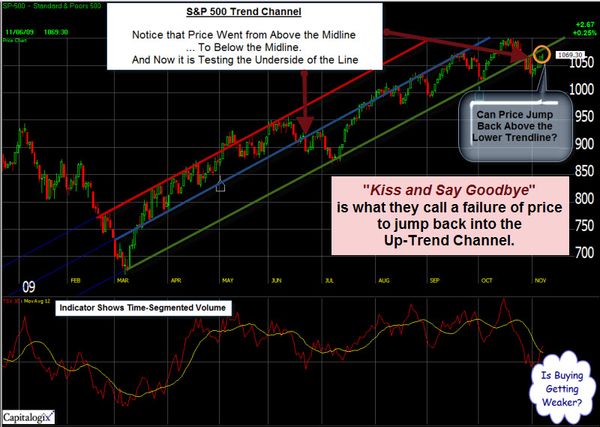
    The chart below shows an upwards sloping trend channel on a chart of the S&P 500 Index.

    1. Notice that the early part of the up-trend stayed above the channel's mid-line (indicated by the blue solid line); and
    2. Notice the second half of the up-move stayed above the bottom portion of the channel (indicated by the green solid line) until recently;
    3. Also notice that the market is recently rebounded to test the underside of this line. I highlighted that portion with an orange circle. This chart pattern is often called "kiss and say goodbye" because a failure to jump back above the lower trendline, back into the upward sloping channel, is often a sign seen at market tops.
    091108 SP500 Trend Channel

    On the other hand, jumping back into the upward sloping channel would be a bullish sign.

    Bob Prechter Calls a Major Top Using the Elliott Wave Pattern.

    If you are looking for Top-Calls, then Bob Prechter is not shy.  He says: "Stocks are topping out, commodities are topping out and the dollar is making a bottom". 

    Prechter is a high profile market commentator who uses Elliott Wave as a framework for understanding the market.  So, I thought this might be an interesting time to re-visit this technique.

    The premise is that the market doesn't affect sentiment.  Rather, it is the other way around;  collective sentiment affects the market.  And that while markets change, human nature doesn't … consequently, predictable patterns play out over and over again. Prechter calls this "Socionomics".

    While I now look at Elliott Wave more as a way of understanding what the market has done (rather than a great predictor of what it will do next), I do believe it is helpful in getting a sense of the next likely swing. 

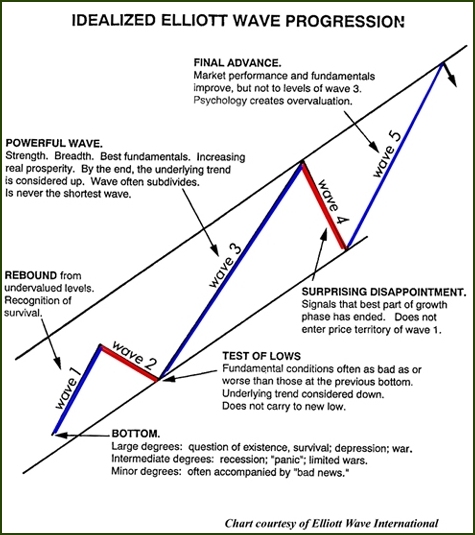
    Here is a chart that shows the basic sequence and an example of the sentiment causing the move.

    090508 Idealized Elliott Wave Progression

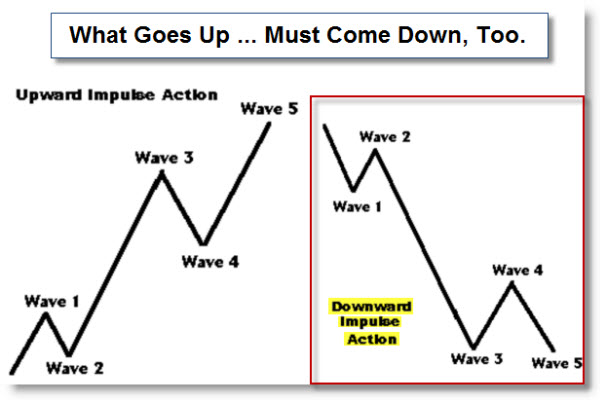
    The next chart shows that a similar sequence often happens in both directions.

    090508 Elliott Wave Pattern Up and Down

    All this reminded me that I have a piece of software called the Advanced GET, which uses a pretty clever algorithm for identifying some of the simpler Gann and Elliott Wave trading patterns. So I dusted-it-off, fired-it-up, and started playing around.

    Looking at a weekly chart of the Russell 2000 Index, it's very easy to envision
    a five wave sequence as follows.
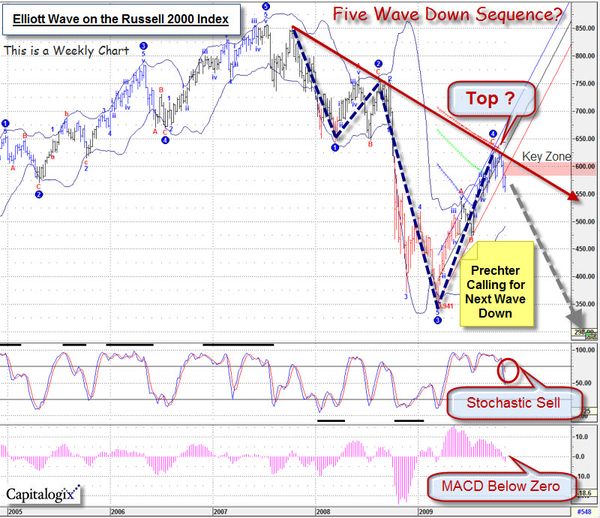
    091108 Russell 2000 Elliott Wave Count

    Note that the wave five target
    is beneath the recent bear market lows. And that the wave four pullback takes us back to the top of the downwards sloping trendline … and seems to have pretty clean Elliott Wave size,
    slope, and timing.

    Again, I don't trade
    the Elliott Wave. Yet it fascinates me, and is something
    that I do pay attention to as a framework.  Add to all this that the daily chart of many US equity indices are stalled at their 50-day moving averages and kissing the bottom of their recently broken up-trendlines, and I'm certainly going to be wary of a pull-back here.

    Business Posts Moving the Markets that I Found Interesting This Week:

    • Does Economics Violate the Laws of Physics? (ScientificAmerican)
    • Fed Tests Tool For Reeling-In Money From Economy. (Yahoo Finance)
    • Time for Companies to Justify Big Gains. (WSJ)
    • How We Got Here: Bush Advisor Analyzes the Financial Sector Meltdown. (WP Carey)
    • Smaller, Faster, Cheaper – The Enterprise Is Changing. (Forbes)
    • Is the Dollar Losing Its Status as the World's Reserve Currency? (WSJ)
    • More Posts Moving the Markets.

    Lighter Ideas and Fun Links that I Found Interesting This Week

  • Microsoft’s Surprising Windows 7 Promotion

    091031 Win 7 Burger King AdMicrosoft released Windows 7 last week.

    Being an early adopter, I found this exciting, challenging, and frustrating all in the same week.

    Speaking of Windows 7, I saw an interesting ad where Microsoft was promoting the launch in Japan through a cross-promotion with Burger King. Here's the ad.

    Who knew that the best way to promote a new operating system and your expected user experience was with seven congealing meat patties and the smell of onions? 

    Maybe Apple took out that ad?

    This is almost as funny as their Songsmith ads.

  • Key Points from Jim Collins’ “How the Mighty Fall – And Why Some Companies Never Give In”

    0910 Verne Harnish and Jim Collins Two business thought leaders that I highly recommend are Verne Harnish and Jim Collins

    They both wrote books I love.  Verne' "Rockefeller Habits" is terrific.  And Jim's "Good to Great" and "Built to Last" are both classics.

    Recently, I heard Jim Collins talk about his new book, "How the Mighty Fall – And Why Some Companies Never Give In". It's a quick read makes a lot of sense.

    Before I talk about the book, here are three things he said that caught my attention. Even out of context they are worth repeating:

    1. It's better to be interested, than to be interesting.
    2. Don't worry about survival or success; instead, wrestle with how to be useful.
    3. Great leaders don't always know the answers … they are, however, great at knowing great questions.

    The Point of the Book: Keep-Up the Disciplines that Make You Great.

    One of the key points was to be terrified of your success. Not because success is bad, in-and-of-itself. Rather, because success often takes you away from the disciplines of building greatness.

    The difference between good and great is often a culture of discipline and a focus on having the right people filling the key seats in the company.

    It is One Thing to Have the Right People On the Bus … How Well Are Your "Key Seats" Filled?

    How many "Key Seats" are there in your company? Perhaps more importantly, ask yourself what percent of these Key Seats do you have empirical proof, and confidence, that the right people are already in-place, doing the right job? Then, ask yourself whether the percentage is increasing, decreasing, or holding steady? 

    If this is important to your company … what are you going to do about it?  And how often are you going to focus on this?

    Most Companies Measure and Manage the Wrong Things.

    Another point he stressed was that what gets measured, gets managed. However, one of the disciplines of greatness is to get beyond measuring what's easy, to define what needs measurement and management. Recognizing the key performance indicators in the key measures of success go a long way towards moving in the right direction, together, as a company.

    Agree to A Committed Action.

    He reminds that great companies are not without disagreement. Instead, they use it as a catalyst to see issues from different perspectives, to get tough conversations out into the open, and then commit to a course of action. Not everyone has to agree with the course of action; yet, everyone should have clarity about what they are agreeing to and what course of action will be.

    "How the Mighty Fall – And Why Some Companies Never Give In"?


    One of the main points of his new book is the downturns are predictable and to some extent, inevitable; however, it doesn't have to be fatal. In fact, it can be the catalyst to the next round of growth on the path to greatness.

    He asks the question: "Why do truly great companies limit growth and set absolute minimum standards, which must be exceeded?" Here is a high-level view of the answer. 

    • It ultimately comes down to rigorous strategic thinking.
    • It means knowing what you do, and doing it well.
    • It means having an important stretch goal, and pursuing it in a disciplined manner. 
    • And it means doing all this with the right people, doing the right jobs, and great management.

    Bottom Line: Stay disciplined … and keep the Main Thing, the main thing.

  • Capitalogix Commentary 11/01/09

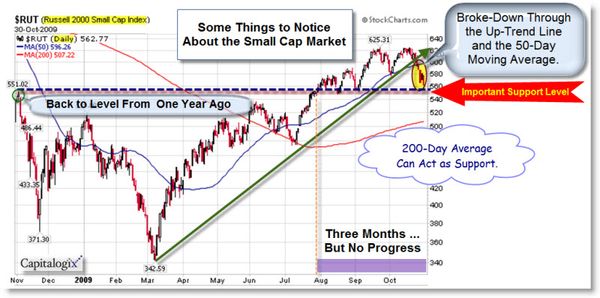
    Last week it started to feel like the markets were breaking-down.   Most of the major US equity indices broke down through their 50-day moving averages and also below their up-trend lines. Likewise, the Dow is back under 10,000 again.

    The chart, below, shows that we are that an important support and resistance level that goes back to November of last year. In addition, we're back to price levels from late July. That means that we've had three months of rally, good news, and talks of "green shoots", with no real price advancement and a decrease of momentum.

    091031 Russell 2000 Index at Support

    From a technical analysis standpoint, this would be a good place to
    reverse and rally. However, longer-term charts and the sheer size of
    the recent rally suggests that we might have a little more market
    correction to go before the decline reverses.

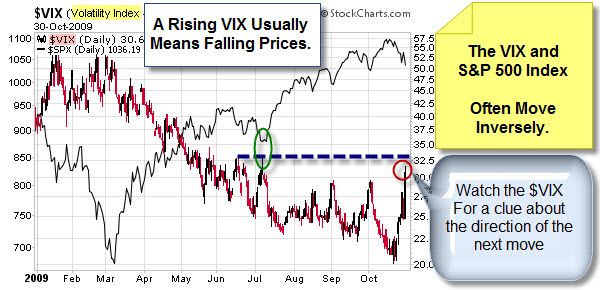
    A Rising VIX Often Means Falling Prices.

    The CBOE Volatility Index  (better known as the "VIX") is a measure of the implied volatility of
    S&P 500 Index options, with very low numbers indicating extreme bullishness
    and very high numbers severe bearishness. It is also referred to as the “fear
    gauge” of US stock markets and is used as a contrary indicator as it moves
    inversely to equity prices. So a rising VIX often means falling prices.  As shown below, the VIX spiked to its highest level
    since early July.

    091031 Rising VIX Falling Prices

    I'm watching the VIX for clues about the direction of the next big move. If fear subsides quickly, then the rally will likely continue.  On the other hand, volatility will increase if the markets remain jumpy.

    What's GDP Got to Do with It?

    Going back to last week, Bears started jumping in on estimates that GPD would fall from 3.0% to 2.7%. Then GDP came in at 3.5%, and suddenly there were a bunch of headlines and news reports that the Recession was over.  As a result, the market blasts 2% higher in one day. My guess, that was more a result of massive short-covering, rather than actual bullish buying behavior.

    It's worth noting that the GDP number was annualized. Real GDP growth for the quarter was 0.87%.

    So far, the Stimulus spending/ Bailouts have
    cost the US more than WWI, WWII, and the New Deal combined… and we get
    GDP growth of 0.87% for Q3?    That's not a sign of a
    strong economy.

    Longer Term: How Does This Compare to Other Bear Market Rallies?

    Here is an interesting inflation-adjusted comparison of three
    Mega-Bear Markets
    . It
    aligns the current S&P 500 from the top of the Tech Bubble in March 2000,
    the Dow in of 1929, and the Nikkei 225 from its 1989 bubble high.

    091031 mega-bear-2000-extended

    Something to keep in mind … while history doesn't always repeat itself … it often rhymes. If so, the next big move is down.

    Business Posts Moving the Markets that I Found Interesting This Week:

    • 2010 Economic Forecast: Don't Hold Your Breath for Fast Growth. (WP Carey)
    • U.K. GDP Numbers Worse Than Most Thought – Down about 5% this Year. (WSJ)
    • Bank Failures Hit 106 Year-to-Date -  Most Since 1992. (MarketWatch)
    • Will Retailers Top Last Year's Holiday Sales? (WSJ)
    • The Good, Bad & Exaggerated in Michael Moore's New Film 'Capitalism'. (Wharton)
    • Venture Firms Making Bets On Forex Start-Ups. (WSJ)
    • Ten Odd Economic Indicators: From Hot Waitresses to Men’s Underwear. (Time)
    • More Posts Moving the Markets.

    Lighter Ideas and Fun Links that I Found Interesting This Week