November 2009

  • Capitalogix Commentary 11/15/09

    What do you think is the most bullish indicator of our markets?  It's not a trick question; the answer is "price".

    The markets have held-up nicely, throughout this rally, despite lots of bad news about the economy. And that, in-and-of-itself, is bullish.

    It doesn't matter what technical analysis indicator you use (increasing negative divergences and selling on down days … or less positive momentum and market breadth), the markets have given us a clear message recently. Price is the primary indicator, and it has stayed above support. 

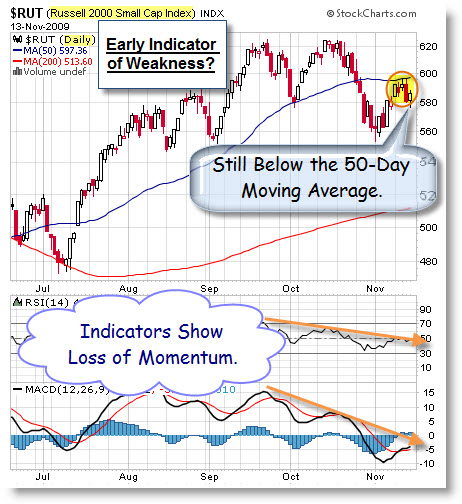
    For example, here is a daily chart of the Russell 2000 Small-Cap Index.  It is holding its gains; yet, sitting at a decision point. 

    091115 Russell 2000 Index Below 50-Day Average

    Last week I posted a chart showing the Elliott Wave count of this index.  Nothing in this chart changes that analysis.

    We can't abandon the discipline of looking to technical analysis, just
    because early indicators haven't tipped us off to the end of rally, yet.  All that means is that the rally hasn't ended, yet.

    The trading action during rallies is often characterized as "climbing a wall of worry".  So, how long can this rally last?  The next section suggests that a rally can last a lot longer than this one has, so far.

    How Does This Rally Compare With Historical Rallies?

    The Dow made another rally high this week, as it moved further above the 10,000 level.

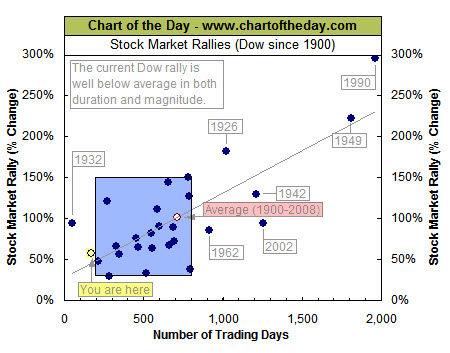
    To provide some perspective to the current Dow rally that began back in March, all major market rallies of the last 109 years are plotted on the following chart from Chart of the Day.

    • Each dot represents a major stock market rally as measured by the Dow.
    • The Dow has begun a major rally 27 times over the past 109 years,
      which equates to an average of one rally every four years.
    • Also, most major rallies (73%) resulted in a gain of between 30% and 150% (29.8% to 150.5% to be exact) and lasted between 200 and 800 trading days (9.5 months to 3.2 years).
    • These "typical rallies" are highlighted in the blue-shaded box.

    As it stands right now, the current Dow rally (noted with the yellow highlight) would be classified as both short in duration and below average in magnitude.

    091115 Length of Rally

    On a different, but related, topic … I think it's time to pay some attention to what's happening to the U.S. Dollar.

    What Happened to the U.S. Dollar – Or … Why Is Everything Else Going Up?

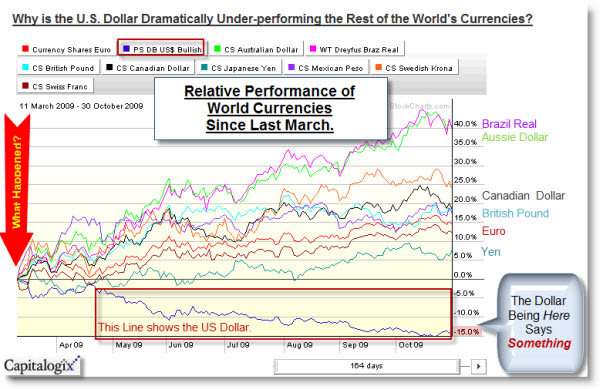
    Here is a Performance Chart showing how the major world currencies have performed since last March.  This chart made me think of the Sesame Street song "One of These Things is Not Like the Others". Notice that all the currencies, except the U.S. Dollar, are up since then.

    StockCharts.com Performance Comparison Chart

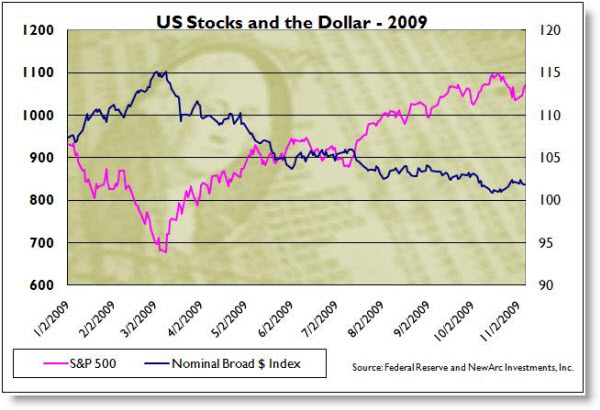
    To me, this implies that the government made a decision near the March lows. Here is a link to an insightful post on why you should care about the strength of the dollar.  In general, there is a strong inverse relationship between the strength of the U.S. Dollar and the strength of the U.S. Stock prices.  Here is a chart showing what that looks like.

    091115 Relationship of US Dollar to US Stocks

    At some point, the economy will be more important than the market.  To that end, U.S. Treasury Secretary Timothy Geithner said a strong dollar is in the nation’s
    interest; and that the government recognizes the importance it plays to the
    economic health of the United States and the global
    financial system
    .  We'll see.

    Business Posts Moving the Markets that I Found Interesting This Week:

    • Cisco's Profit Falls 19% – Shares Rise Anyway. (WSJ)
    • Roubini: Bernanke Can Avoid A Crisis by … Actually He Can't. (BusinessInsider)
    • Congressman Ron Paul Says Be Prepared for the Worst. (Forbes)
    • Fed Sees No Need to Raise Rates Soon. (NYTimes)
    • Buffett's Unusual Train of Thought on Burlington Northern. (WSJ)
    • A VC Win: Greylock Partners Raised a $575MM new fund in six weeks. (WSJ)
    • More Posts Moving the Markets.

    Lighter Ideas and Fun Links that I Found Interesting This Week

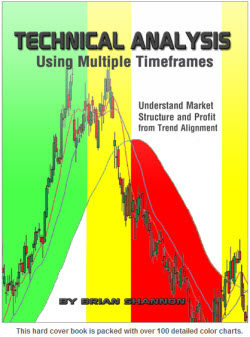
  • Review of Alphatrends’ Book on Technical Analysis Using Multiple Time Frames

    091115 Technical Analysis Book This is one of the few books that I recommend to traders regardless of
    their expertise. There's something valuable in here for novice traders,
    and perhaps even more for experienced traders.

    The book was written by Brian Shannon. He is a professional trader; and he has developed quite a following on Twitter under the name "AlphaTrends".

    Over the years, I've read many books about trading, the markets, and psychology. This book is a very nice combination of those topics, with some common sense thrown in for good measure.

    What is in the Book?

    The book starts by explaining some basic technical analysis concepts, like trends, moving averages, and support & resistance levels.  Next, Shannon explores some of the common volume and market patterns (dealing with what to expect, and why it happens that way).

    He also talks about the four stages of a stock's economic cycle.
    Whether you call it expansion, peak, decline, and recovery … or …
    accumulation, mark-up, distribution, and decline … these four stages
    show-up repeatedly, in different stocks and on different time
    frames. Recognizing these cycles, and what they mean, is a good step forward in understanding the markets and which techniques are most
    likely to work in a particular market condition.

    The Disciplined Trader.

    Along the way, he also does a nice job pointing out some of the nuances of trading, from risk management to exit strategies.  This is a book that balances opportunity with defense and discipline. 

    I appreciate that the book focuses on the risk management side of trading, and doesn't pretend that there are magic indicators or trading systems. He stresses that risk management and position sizing are more important than what you choose to trade.

    More Than Patterns: The Entry and Exit Matter Too.

    Shannon states that his edge is based on observing the market clearly and objectively, then implementing trades based on what the market dictates. He teaches to initiate a trade only when you have a perceived edge and the price action confirms your theories.

    He warns that the most difficult job on Wall Street is
    picking tops and bottoms.  There are lots of lower risk ways to trade.  For example, while trend following is one of the techniques he advocates, he explains how using multiple time frames helps you identify trend alignment, which you can then use to help place trades during situations where you have a better edge.

    Common Sense Insights About the Markets Isn't as Common You Might Hope.

    As Shannon describes the different patterns, he does a nice job of
    providing charts and narrative to explain what's happening, what some
    buyers might be thinking, and why he takes (or avoids) trades at
    different points in time.

    He cautions that the market is not always rational and "reasons" are often revealed only after price has moved.

    I like that reading this book feels like you're having a conversation
    with someone who really knows what they're talking about.  And as you
    get further through the conversation, you realize that you're making
    progress, learning new things, making new distinctions, and putting
    things together in a way you hadn't thought of before.

    This book doesn't talk down to readers; yet, it doesn't try to dazzle them either. It's well-written, balanced, and full of practical ideas and insights.

    Bottom Line, it's certainly worth reading.

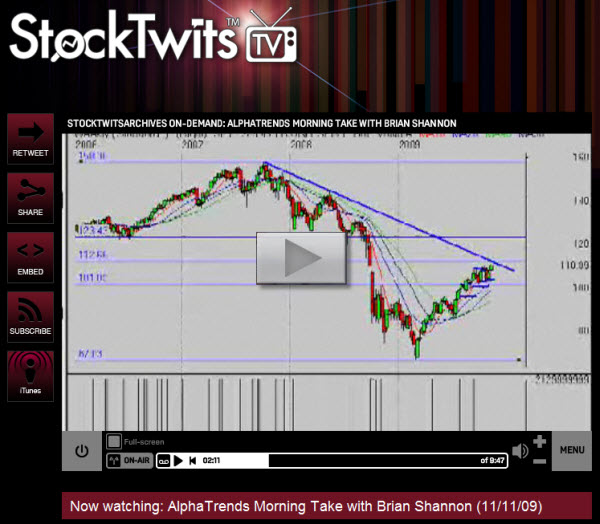
    In addition, click the picture below to watch a recent video he did about what's happening in the market.  It is a nice example of his trading style.

    091115 AlphaTrends Market Commentary

    Brian Shannon Other Resources:

  • This Video Made Me Smile

    Watch a soldier being greeted by his dogs after returning home after 14 months in Iraq.  I suspect even cat people will be touched by this.

    I learned something from the dogs, and the man.  Hope you enjoy it too.
     

  • This Video Made Me Smile

    Watch a soldier being greeted by his dogs after returning home after 14 months in Iraq.  I suspect even cat people will be touched by this.

    I learned something from the dogs, and the man.  Hope you enjoy it too.
     

  • Jump Point: How Network Culture is Revolutionizing Business

    This is a compelling book.  The title refers to a change in the environment, so startling that we have no choice but to re-group and re-think the future.

    When it happens, everything changes and the old trusted rules of the road to go out the window.

    The book hype says: The Web 3.0 world of “pandemic economics” is a new economy that will
    function outside the traditional laws of commerce, free from today's
    impediments to business growth, and in a world where every person is
    connected to each other. Jump Point will help you to challenge old assumptions, re-think your business
    models, and take advantage of this fast-moving, unfettered, and
    fiercely competitive environment.

    When Does It Happen?

    The economic history of the world is punctuated by Jump Points. The tricky part has been identifying them at the right time.

    Very often, we mistake the arrival of a stunning new invention for the Jump Point.  It is easy to get mesmerized by a new innovation, and to think the world has changed the day a new technology leaves the lab. But that is rarely, if ever, the case. That is not the Jump Point.

    Instead, technology revolution is a fitful process. New technologies take time to be absorbed, diffused and adopted. We are a curious species; it is human nature to tinker, and experiment, test, and play. And most inventions improve with application, adoption, and time. Therefore, most Jump Points occur well after the enthusiasm settles and the parade has passed.

    Real Jump Points most often arrive after we grow complacent about that invention, when the technology becomes routine and unremarkable, after the novelty has worn off and the technology has gone mainstream. It is then that rapid change finally happens.  Interesting.

    Jump Point: How Network Culture is Revolutionizing Business

  • The Rules Are Changing

    Goldman Sachs lost money trading only
    one day last quarter, and only two days the prior quarter.

    Come on, how could that be? Their boss does say that banks “Do God’s work.”  I’m not sure that is a sufficient explanation.  When a firm’s trading performance challenges not only all preconceptions of realistic trading, but also of statistical distributions, it’s worth looking into.

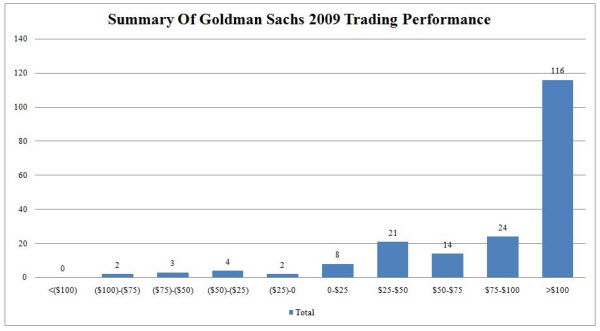
    Here’s what ZeroHedge has to say about it.  Here is a chart that demonstrates Goldman’s YTD trading track record: out of 194 trading days in 2009, the firm has made over $100 million on 116 occasions! This alone accounts for at least $11.6 billion in revenue (and is likely much more).

    091108 GS Trading Performance

    Yves Smith, at Naked Capitalism, adds: maybe I am just hopelessly out of touch, or perhaps more accurately, the
    Fed has created such a ridiculously favorable environment for banks and traders
    that if you are moderately competent, making money is like shooting fish in a
    barrel. But a winning streak this consistent looks like a rigged game. Is this
    just, ahem, “information advantages”? Greater ease in pushing markets around
    that have fewer players? Just a function of those monstrously wide bid-asked
    spreads? I’m curious for a sanity check from people closer to the action.

    The party line comes in the Financial
    Times
    :

    The performance – revealed on Wednesday in a regulatory filing – compares
    with two losing trading days in the previous quarter and confirms that the
    authorities’ drive to revive markets after the crisis is yielding huge windfalls
    for some banks.

    Before the crisis, banks regularly recorded trading losses on several days in
    a quarter.

    Goldman made more than $100m in profits on 36 of the 65 days in the three
    months to September and recorded more than $50m in profit on more than eight out
    of 10 trading days, the filing shows.

    These figures were down from the second quarter, when Goldman reported record
    trading revenues and had 46 days with $100m-plus in profits. The smaller number
    of days with $100m-plus profits in the third quarter partly reflects the bank’s
    decision to rein in risk-taking in areas such as interest rates and
    equities.

    There is a suggestion here that banks like Goldman might be taking advantage
    of the Fed and Treasury (although that might be by design, yet another hidden
    subsidy).

    Let me know what you think about this.

    Here is a how there stock is doing.

    Here is a link to a prior Goldman Sachs article worth checking-out.