November 2009

  • Capitalogix Commentary 11/29/09

    091129 Dubai Landmark Black Friday came in several ways this year.  Yes, there was shopping.  However, the markets had a dark few days, too, as the world markets quaked at the news of Dubai's sovereign debt default.

    I've always believed that you can tell a lot about the current character of the market based on how it responds to news. Sometimes markets go up on good news, and go down on bad news. That seems normal. On the other hand, I take it as a bearish sign when markets sell-off after good news. Likewise, I take it is a bullish sign when markets go up, despite bad news.

    So, it wasn't surprising that markets reacted negatively to the largest sovereign debt default since Argentina. It was, however, somewhat bullish that the US equity indices went down as little as they did. Yes, I know that our markets were closed on Thursday (when most of the damage was done globally) because of our Thanksgiving holiday. And I also realized that Friday was a half day and had relatively light volume. Nonetheless, it could have been worse; much worse.

    Here is a link to a post I wrote that I think is worth reading at this point in the markets. I called it "What My Dogs Can Teach Us about Markets".  It's really about how perceived danger puts us on alert; and why the second perceived danger often receives an even greater response. The point is that the world is now on alert, and I'm watching how calmly (or not) the market reacts to news.

    Market Commentary.

    The markets continue to hold up well on the surface.  Underneath, I'm seeing signs of weakness (poor breadth, weak up-volume, fewer new highs, more negative divergences, etc.).  Nevertheless, price has stayed above important levels.

    With that said, here are some patterns worth watching.  This chart uses 15-minute bars to get an intra-day look at the S&P Mid-Cap Index throughout November. The most notable thing I see is a character change in mid-month.  The Bullish Break-Away Gaps seen at the beginning of the month are followed by two Bearish Island Reversal patterns (marked by the yellow boxes) in the second half of the month.  This type of pattern can be seen at market tops.  It starts with a gap-up (shown by the green circle) and ends with an exhaustion gap (shown by the red circle). You can click this chart to see a full-size version.

    091128 EMD_15min_Nov
    To understand what this pattern shows, you can think of it as the last buyers
    rushing to get in (pushing-up price so fast that it creates a
    break-away gap), only to find that there are no new buyers (causing a
    price drop and the resulting exhaustion gap).  This gap down can signal
    the beginning of a change in trend. Two of them in a row makes me more watchful.

    David Corna reminded me that this pattern shows-up differently on a higher time-frame. For example, on a daily candlestick chart, the intra-day Island Reversal manifests as two classic reversal patterns, a Hanging Man followed by an Evening Star. Their very names are onomatopoetic to their meaning. These candlestick formations will almost always be found at the end of a trend and the beginning of a reversal.

    Chart.ly from StockTwits is a Good Source of Ideas.

    Many traders use charts and technical analysis to gain insight and perspective on what's happening in the markets.  I'm always looking for resources that help me do that.  Recently, I've found a lot of good content on the Chart.ly website.  It is part of StockTwits, and has a strong user community.  Here is an example of a chart I found there this week.

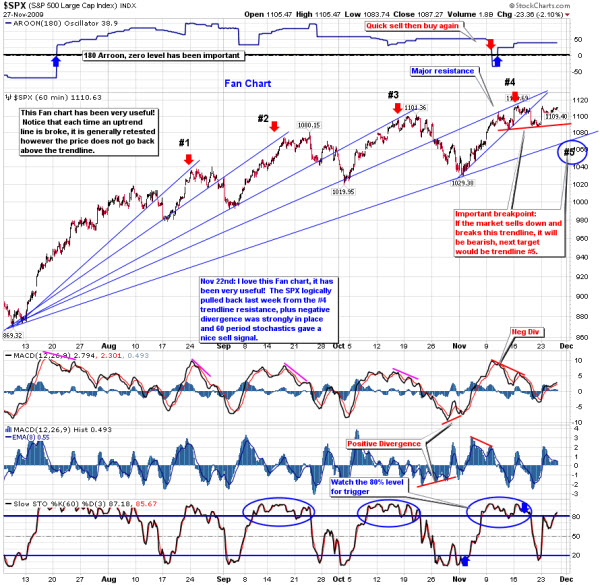
    091129 SP500 Since July

    I like the analysis, and concur that the bottom trend-line (and the area on the far right of the chart marked by the blue circle) points to a key price area.  Staying above that is important for the rally to continue.

    How bullish has the rally been in real economic terms?

    What the Dow Priced in Gold Tells You?

    This chart shows the Dow Jones Industrial Average priced in Gold.  In other words, how many ounces of gold does it take to buy the Dow's price?  So, for example, when the Dow is at 10,000 and Gold is $1,000 per ounce, it would take 10 ounces.

    091129 Dow Priced in Gold Since 1900

    Here is a similar chart, limited to the past ten years.

    091129 Dow Priced in Gold Since 2000

    As you can see, it took over 40 ounces of Gold to pay for Dow in early 2000.  It now takes around 8.75 ounces. From this perspective, it looks like the Dow lost 80% of its value. That seems significant, even though the Dow's price is back close to the levels traded in the year 2000.

    I don't normally put too much stock in charts that show one asset priced in another.  If it was supposed to be priced that way, it would be … However, this comparison seems more relevant to me because gold is a form or currency.  Also, as people decide what to invest in lost opportunity cost is a factor.

    How is the Economy Doing?

    Here is a chart from Russell Investments that identifies a few key economic and market indicators to help assess the current economic health and trend.  Click the chart for an interactive version.

    091129 State of the Economy

    Business Posts Moving the Markets that I Found Interesting This Week:

    Lighter Ideas and Fun Links that I Found Interesting This Week

    • Alpha Males Must Trade on More than Machismo. (FT)
    • America's Healthiest and Unhealthiest States. (MSN Health)
    • In Tough Economy, Tighter Belts Mean Thicker Waists. (WSJ)
    • Man in ‘Coma’ Heard Everything for 23 years. (MSNBC)
    • Clicker's Online TV & Movie Guide Impresses. (Newser)
    • Answers to 15 More Google Interview Questions that Will Make You Feel Stupid. (Insider)
    • More Posts with Lighter Ideas and Fun Links.
  • A Bohemian Rhapsody in Three Parts

    Compare the original to the Muppets' version and a parody. Some things are classic. Some things are good enough to stand-up no matter who performs it.  You be the judge. 

    A Little Background.

    "Bohemian Rhapsody" is a song written by Freddie Mercury, originally recorded by the band Queen
    for their 1975 album A Night at the Opera.

    The song is a parody of a
    rock opera
    and has a very unusual musical structure for a piece of
    popular music. Its three different sections have no chorus but both a
    cappella
    and heavy metal arrangements. Despite this, it was released as a single and became a huge commercial success, marking a decisive point in Queen's
    career.

    The single was accompanied by a
    groundbreaking "promotional video", which helped establish the visual
    language of the modern music (and helped make the music video a must have accessory for any performer).

    Muppets – Video of Bohemian Rhapsody:

    The Muppets have created their own version of Queen's classic song and video.  This version has very quickly gone viral, as people around the world flock to see it.

    The Muppets released their version of Bohemian Rhapsody as a funny and endearing tribute marking the 18th anniversary of Freddie Mercury's untimely death. 

    While there will never be another Freddy Mercury, neither will there be another Gonzo, Fozzie Bear nor Miss Piggy.  Here is their attempt at rock opera:

    Bohemian Bankruptcy – A Tragedy by Drag Queen.

    This, completely different, take on the classic is a witty parody of our economic times.

    The Original: I Saved the Best for Last.

    Here is the original.  After all this time, it still speaks for itself.

    Here is a link to that video with the lyrics superimposed.

  • Capitalogix Commentary 11/22/09

    Obama's China Visit.

    President Obama asked for patience about the economy.  Nonetheless, a Gallup poll showed his job approval rating had dropped to 49 percent, the first time he has fallen below 50 percent in this survey, as Americans express dissatisfaction with his handling of the economy and other issues.

    Unfortunately for him (and us) that wasn't the only voice of dissatisfaction he's heard lately.

    Obama's 091122 Obama Fortune Cookie From His Visit to China

    Also, here is a skit from Saturday Night Live.  Like most good humor, it is funny because of how much is true.  I'm not posting it for partisan reasons … rather, it made me laugh.  Hope you enjoy it too.

    Market Commentary: Spotting an Island Reveal Pattern.

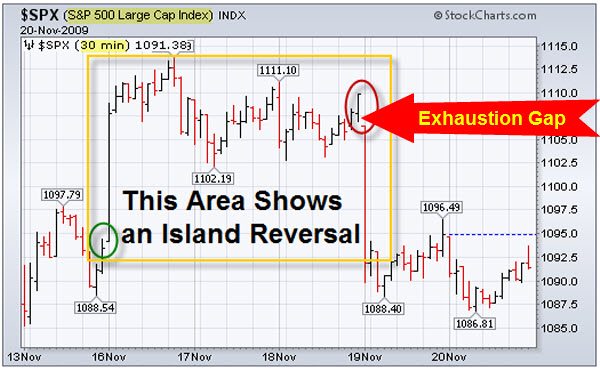
    In general, the markets held-up again this week.  As I scan the charts, there is little new or opinion-changing information.  However, I spotted an Island Reversal pattern on an intra-day chart of the S&P 500.  This is often seen at market tops.  It starts with a break-away gap (shown by the green circle) and ends with an exhaustion gap (shown by the red circle and the big red arrow). 

    091122 SP500 Index Island Reversal

    To understand this pattern, you can think of it as the last buyers rushing to get in (pushing-up price so fast that it creates a break-away gap), only to find that there are no new buyers (causing a price drop and the resulting exhaustion gap).  This gap down can signal the beginning of a change in trend. 

    In this particular case, we are coming into a holiday-shortened week (often characterized by light trading).  So I'm not expecting anything dramatic.  Still, it seems worth watching to see if the market trades back up above the exhaustion gap.

    Something Changed: Small Caps and Techs are Not Leading The Way.

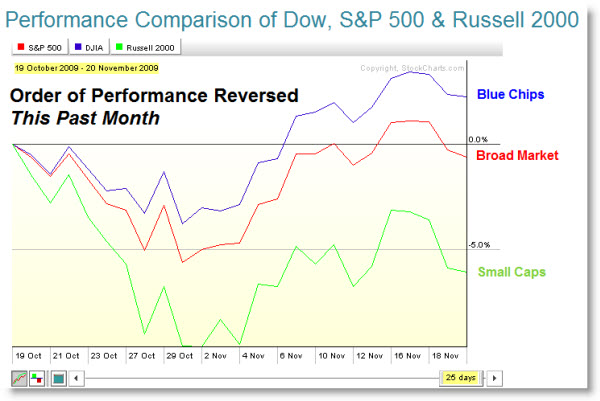
    Here is something else that caught my eye.  The chart below shows that the Russell 2000 Index (shown in green below) has led the way throughout the recent rally.  The S&P 500 Index (shown in red below), represents the broader market.  While the Dow Jones Industrial Average (shown in blue below) lagged.  You can click the chart image below to launch an interactive version on Stockcharts.com.  This chart shows the relative performance of these indices during the past year.  You can adjust the date range by dragging the date bar at the bottom.

    091122 Index Performance Comparison this Year

    The next chart shows the same information, except limited to the past month.  Notice that the relative performance of these indices has reversed. 

    091122 Index Performance Comparison this Month

    I'm watching this rotation to see if small caps recover or continue to show weakness.  They could be the canary in the coal-mine for a bigger correction.

    Business Posts Moving the Markets that I Found Interesting This Week:

    • Fed Eyes Dollar Drop, But Clings to Low-Rate Pledge. (FluentNews)
    • Goldman Outlines Fed’s New Dashboard Indicators. (WSJ)
    • Buffett Says His Businesses Have Bottomed (Reuters)
    • Memo to Buffett: Put Down the Pom-Poms & Tell Us the Truth. (HuffingtonPost)
    • New Market Bubble is Brewing: It's Déja Vu All Over Again. (Newsweek)
    • While U.S. Economy Struggles, China's Rises. (NPR)
    • More Posts Moving the Markets.

    Lighter Ideas and Fun Links that I Found Interesting This Week

  • A Matter of Perspective

    What could turn this boy, who I happily go to Cowboys games with …

    091119-HMG-and-ZAG-at-Cowbo

    … Into this boy?

    091119-HMG-and-Zach-as-a-Bl

    When it happened, I posted this comment on Twitter: "My high-school age son came home today as a Platinum Blond. Hooray … it makes guessing 'What's Next' so much more fun." 

    The responses were clever.  One guy said: "Grounding is next, I expect."  Someone else thought providing a little contrast would help. They said: "Here's what could be next … Well, hope not … but you never know".  Click this link to see what they were referring to.

    As it turns out, his blondness was something many football players did to celebrate their team making the play-offs and getting to play at the new Cowboys' Stadium.

    091122 Zach in Star at Cowboys Stadium
    Somehow (in this context) he looks better to me already … But he doesn't have my burst of slowness, yet.

    The point is that many things we initially perceive one way, may turn out to be something quite different all-together.

    Here is a Story to Illustrate This Better … And to Make it Stick.


    091119-Village This is another one of those stories I get, in different forms, from time-to-time.

    It is called "Who Knows?" And sometimes it is told as an old story from China, while other times it is set during the American Civil War.

    Nevertheless, "Who Knows?" is one of those  "sticky"
    stories that people like to re-shape and re-tell.  So, with no further
    ado, here it is for you to read for yourself.

    Who Knows?

    A farmer's horse ran away one day and all the villagers came to him saying, Oh what bad luck you've had! Your horse that you need to do your work is gone!

    The farmer shrugged his shoulders and said, Good luck, bad luck. Who knows?

    Several days later, the farmer's horse returned, followed by a herd of wild horses!

    Oh what good luck you have, cried the same villagers! Not only has your horse returned, he has brought you many horses!

    The farmer again shrugged his shoulders and said, Good luck, bad luck. Who knows?

    One day not long after, the farmer's son was trying to break one of the wild horses. He was thrown off the horse and broke his leg.

    Oh what bad luck you have! Cried the villagers. Now your son has a broken leg. Who will help you?

    The farmer shrugged his shoulders and said, Good luck, bad luck. Who knows?

    Not long after, as the son was recuperating, an army came through the village and took all the young males to fight in a war in another region. They did not take the farmer's son because of his broken leg.

    Oh what good luck you have! The villagers cried once again. Your son has been spared being taken off to war because of his broken leg!

    The farmer shrugged his shoulders and said, Good luck, bad luck. Who knows?

    We Don't Know … Yet.

    This is a great story to remember when you're projecting far beyond the present moment … or even when you're just worrying about what will happen next?

    The things we think are good fortune can often have bad endings; and vice-versa. How many times have you looked back on what seemed like bad luck, when it happened, but later realized that it was the start of something better?

    Made to Stick

    Made to StickThis story reminded me of the book by Chip and Dan Heath, called Made to Stick: Why Some Ideas Survive and Others Die.  It is a fascinating explanation about what makes an idea memorable or interesting.

    The
    premise is that you should focus on the six things that make ideas
    stick – which they summed up in the mnemonic "SUCCES" (yes, I know that
    success has two "s"s at the end … I didn't make up the acronym). 
    Here is what that represents:

    • Simple — find the core of any idea;
    • Unexpected — grab people's attention by surprising them;
    • Concrete — make sure an idea can be grasped and remembered later;
    • Credibility — give an idea believability;
    • Emotion — help people see the importance of an idea;
    • Stories — empower people to use an idea through narrative.

    Other Resources:

  • A Lesson Learned About the Time-Value of Living

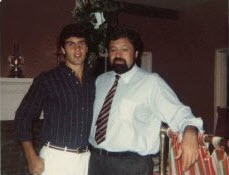
    091115 Me and My Dad This weekend marked 10 years since my dad passed away.

    It's amazing to me how fast time flies, and yet how important he still is in my life. Rather than mourn his death, I celebrate what a great job he did living.

    One of the things his passing taught me was the "time-value of life".

    At the end, to him, one more year of living seemed priceless. Yet at that point, he was older and more infirm than at any other point in his life.

    Wouldn't it be better to recognize the importance of living fully, earlier?

    In other words, the best way to capture and leverage the value of this year is to live it fully now.

    Wouldn't now be a good time to start?