

How easy will it be to pass the $3.8 Trillion Dollar Budget? Well, here is a chart that shows President Obama's Job Approval ratings. So, harder than it would have been.

Perhaps this is a better graphic to explain what is happening.

It is interesting that markets have gone up while President Obama's popularity continues to go down. Apparently, sentiment is not caused by what happens in the markets. Beware, however, if market price is caused by sentiment … because sentiment is not pretty right now.
Critical Juncture for the Equity Markets.
Markets are often confusing. This is one of those relatively rare times where the main issue is staring the world in the face. I say that because so many of the world equity market charts look the same.
This chart shows a weekly view of the S&P 500 Index. There is a pretty clear down-trend line starting from the market's high in October 2007. The market rallied back to the underside of the line, and has fallen from there.
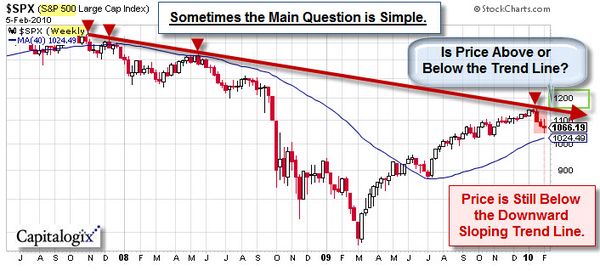
In order for the market to meaningfully rally, it must get past that overhead resistance (marked by the big red arrow). In the short-term, bulls can take some comfort on the way the market rallied off the lows to close Friday's session. That is often a sign of a bullish reversal.

We'll see what happens.
Business Posts Moving the Markets that I Found Interesting This Week:
- Will Obama's Proposed 3-Year Freeze on Some Types of Spending Work? (NYTimes)
- Bernanke to Testify on Fed Exit Strategy this Week. (Bloomberg)
- Taleb:
"Every Single Human Being" Should Short Treasuries. (BusinessInsider) - Money Market Funds Can Now Prevent Redemptions. (MoneyNews)
- Rep. Barney Frank Calls for Abolishing Fannie Mae, Freddie Mac. (USAToday)
- More Posts Moving the Markets.
Lighter Ideas and Fun Links that I Found Interesting This Week
- Amazon Losing the E-Book Pricing Battle. (ZDNet)
- A Different Type of Telescope That Sets Its Sights On Cyber-Crime. (NewScientist)
- 'American Idol' Wants Howard Stern to Replace Simon Cowell as Judge.
(NYPost) - Innovation – How Far Can You Trust an AI Assistant? (NewScientist)
- Priest Checks Fingerprints of Mass Attendees. (Reuters)
- More Posts with Lighter Ideas and Fun Links.


