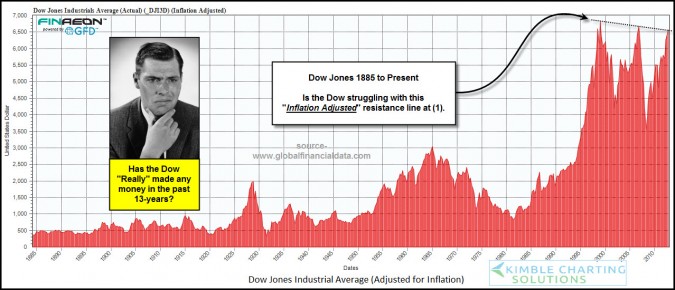
This chart displays the price of the Dow going all the way back to 1885 — and adjusts it for inflation. Clearly, if you do that, it is lower now than it was 13-years ago.
But, does the series of lower highs (marked at the far right of the chart) imply a meaningful technical analysis resistance level? Moreover, can you safely infer that the Dow is 'struggling' with that level? I don't think so.
Technical analysis is supposed to help you understand, and respond intelligently, to what is happening in the market. This pattern seems more coincidental, rather than causal.
Support and resistance zones supposedly reflect meaningful price points where a genuine disagreement between the Bulls and Bears is contested. I doubt this pattern was caused by Traders making big bets based on inflation-adjusted charts.
Consequently, I view this as interesting, but not tradeable, information … What about you?
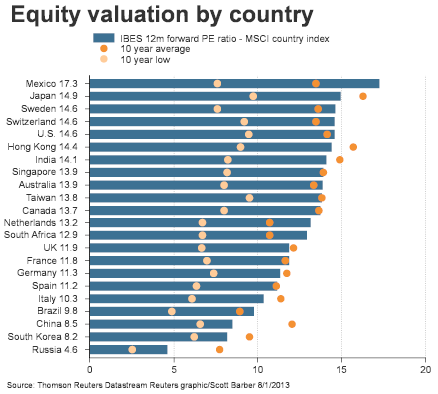
How high is high? Here's a comparison based on historical PE ratios.
Most country equity valuations are trading at their 10-year average valuation or lower. However, a few countries like Mexico, Sweden, Switzerland, and the United States are trading at levels above their respective 10-year valuations.
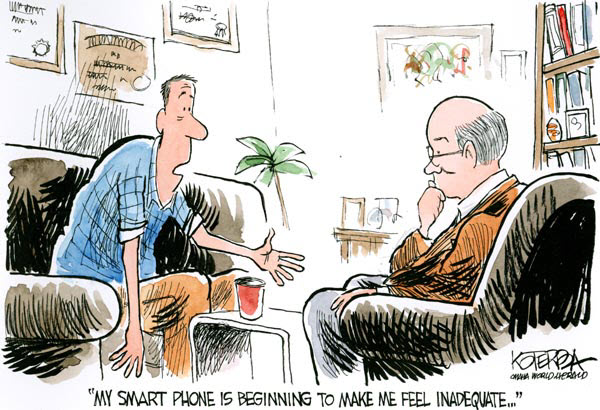
I just spent a few days with family. While that was great, what struck me was how much different our time together was now. Each of us was constantly checking our phones or watching the proceedings through the camera's viewfinder.
We seem to take it for granted that more of our time and attention is spent staring into a screen.
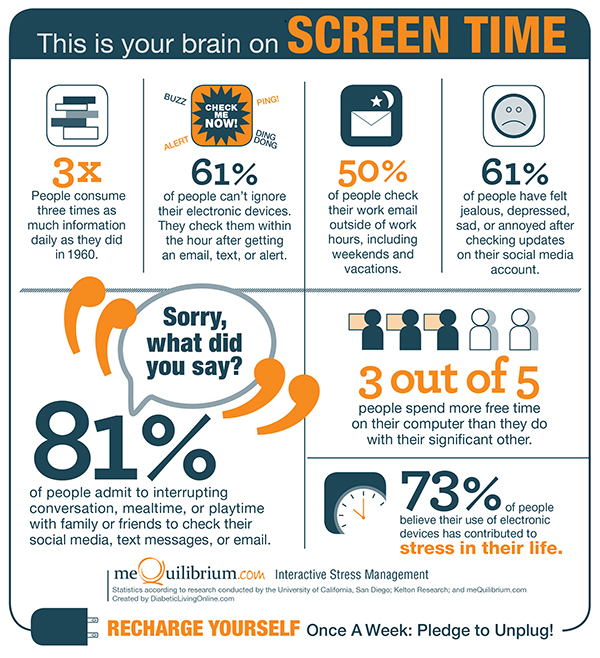
It's become our central interface with the world. In fact, we're consuming as about three times the amount of information today that we did in 1960, according to researchers at University of California, San Diego.
What does this do to our brains, attention span, relationships, and moods?
It would be one thing if our phones just sat there quietly until we needed them. But they don't. They exert a kind of tyranny over our attention and actions. Sixty-one percent of respondents said they cannot ignore their devices and check them within an hour of receiving an email, text, or alert — and 81 percent of those surveyed interrupt conversations, meals, all kinds of fun things, to do it.
Rethink the urge. When you feel yourself reaching for your phone, hit pause. Ask yourself what could be gained from checking right now. Delay it–especially if you're in the middle of food or conversation.
We Feel Worse After Checking
I could almost understand the Pavlovian response we have to buzzing and ringing if we were guaranteed to feel better after tuning in to our screens. But it turns out we'll stop mid-sentence or mid-chew to check our email and texts — only to feel worse. Sixty-one percent of those surveyed reported feeling jealous, depressed, or even annoyed after checking updates! It's no surprise, then, that 73 percent of respondents believe that their devices contribute to stress in their lives.
Rethink the effects. Next time you do a quick scan of email, text, and social networks, ask yourself, what did you learn and how did it make you feel? We rarely take the time to reflect on it, but doing so and owning up to how it makes you feel and what, if anything, it's doing for you, is the first step to making a shift.
We Spend More Time With Screens Than People
It's bad enough that we'll stop what we're doing with those we love to do something that will undoubtedly leave us more stressed — but more and more people are opting for screen time over the company of others. Three out of five people admitted to spending more of their free time on their computers than with their significant others.
Rethink your time. Rather than let digital inertia take over, make a plan: to go out, to see people, to get food, meet someone for a walk. It does require an extra effort to put yourself in front of other people, even the ones you live with — but the rewards you'll reap from that company will outweigh anything you'll find on Facebook.
“Life is about creating opportunities and taking advantage of opportunities’’ Jason Garrett told his team at the the start of the Dallas Cowboys' training camp.
Was the speech a motivational masterpiece? You decide.
Some Notable Quotes:
On coaches:
“The coaches I hate—that I had a visceral reaction to—were the guys who told me, ‘You’re doing a great job.’ … And allowing me to be as mediocre as mediocre could be,” Garrett said. “None of us need help being mediocre—especially me. Coach my ass! … You been to the Pro Bowl eight times? You’re getting your ass coached. You just got here 15 minutes ago? You’re getting your ass coached. First-round picks, free agents who signed for nothing—everybody’s getting coached.”
On how players should handle interviews/media:
Garrett said, players should be “respectful, brief, boring and humble … Distinguish yourself with your play, not what you say.”
On handling distractions:
“Don’t listen to the noise,” he said. “Think Einstein listened to the noise? Think Martin Luther King listened to the noise? Be strong enough mentally, be strong enough physically” to tune the distractions out.
The Cowboys were silent for almost the entire 35 minute speech. Curious whether that was a sign of focus or lack of engagement?
If you have a short-attention-span, here is the four-minute version with some highlights.
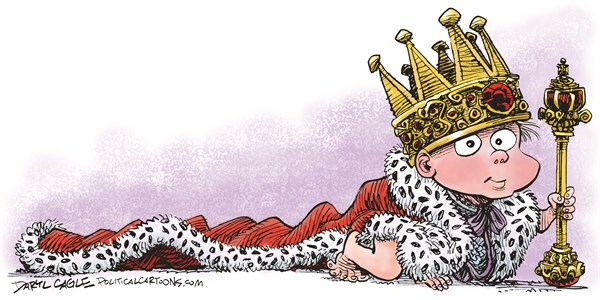
Summer time and lots of people have vacation on their minds. The royal baby certainly captured a lot of news cycles. The future king was born in England at 8 pounds. What's that, like $12.28 US dollars.
Here are some of the posts that caught my eye. Hope you find something interesting.
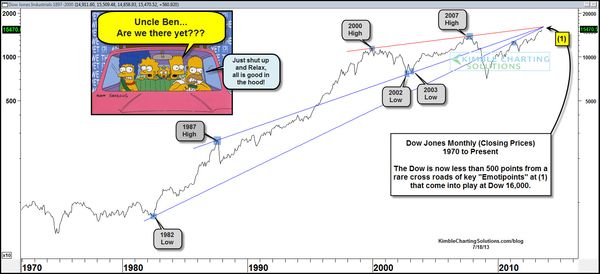
What do you get if connect these key "Emotipoints" (Emotional highs and lows)… The 1982 low, 1987 High, 2000 high, 2002 low, 2003 low and 2007 high together?
According to Kimble Charting, you get a rare combo of resistance coming into play at Dow 16,000.
The Dow industrials has been hitting record highs and is now less than 500 points (less than 3%) from this potential key technical price point.
From a technical perspective, the trend is your friend … and if the Dow does break above this resistance level, it will be viewed as a big positive by the Bulls.
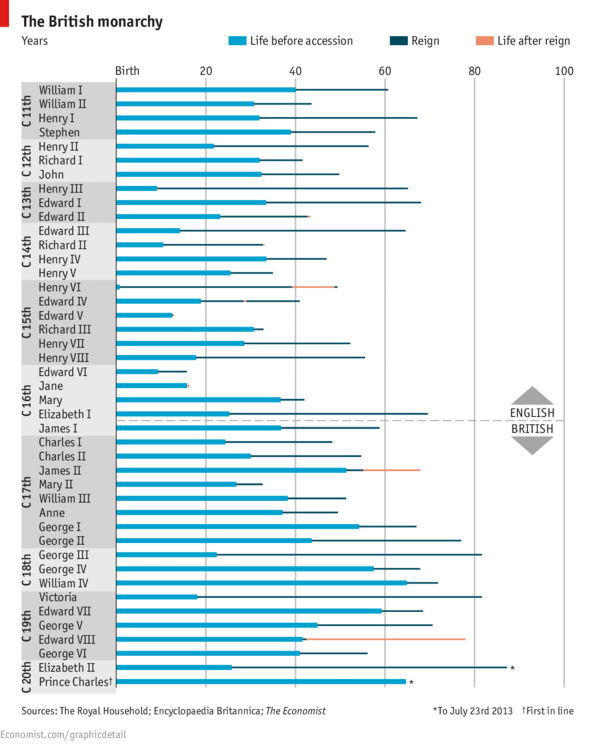
This week, Prince William, the grandson of Queen Elizabeth II, had a son. That means the new baby is third in line to the British throne; but it could be decades before his reign starts.
According to the Economist, Prince Charles, 64 and first in line, will soon become the longest king-in-waiting.
Since the first William (the Conqueror), the average age of accession has been 3, which coincidentally is Prince William's current age).