Trading Tools

  • The S&P 500 Index is Entering a Seasonally Weak Period

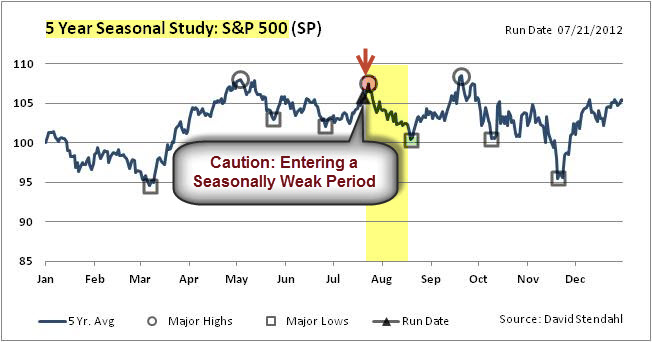
    The S&P 500 Index is entering a seasonally weak period.  The chart below shows the predicted turning points based on the past five years of historical data. 


    120724 Seasonally Weak Period 

    History does not typically repeat itself, exactly; but it often rhymes.  So, it makes sense to keep seasonal tendencies in mind.  With that said, some things potentially different this year include that this is an election year and world governments are coordinating central bank stimulus actions.

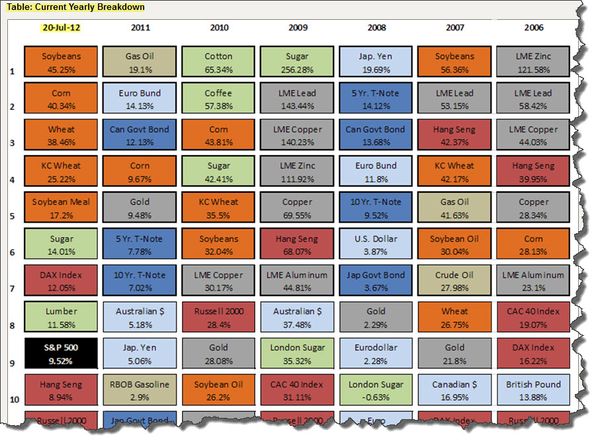
    However, the chart below should serve as a reminder that there a lot other markets worth trading too.  For starters, Soybeans are up 45.25% so far this year.

    The chart shows the top-ten performing markets, ranked by yearly performance, for the past few years.   The data is color coded based on sector. The first column posts the current year's open performance followed by six columns of closed yearly market performance.


    120724 Yearly Performance Comparison 120724 Yearly Performance Key
     
    Note how much diversification there has been in the top-ten throughout the years.  Click the chart to see an expanded version of this data (showing 40 global futures markets).

    That is the funny thing about markets … something is always working.  The trick is finding it while it's working.

    Enhanced by Zemanta
  • Socrates’ Triple Filter Test and the Modern World

    Small distinctions separate wise men from fools.  Perhaps one of them has to do with what the wise man deems important.
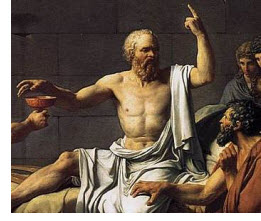
     

    090501 Socrates Socrates' Triple Filter.

    In ancient Greece, Socrates was reputed to hold knowledge in high esteem.  One day an acquaintance met the great philosopher and said, "Do you know what I just heard about your friend?"

    "Hold on a minute," Socrates replied. "Before telling me anything, I'd like you to pass a little test. It's called the Triple Filter Test."

    "Triple filter?"

    "That's right," Socrates continued.  "Before you talk to me about my friend, it might be a good idea to take a moment and filter what you're going to say. That's why I call it the triple filter test.

    The first filter is Truth.  Have you made absolutely sure that what you are about to tell me is true?"

    "No," the man said, "Actually I just heard about it and…"

    "All right," said Socrates. "So you don't really know if it's true or not. Now let's try the second filter, the filter of Goodness.  Is what you are about to tell me about my friend something good?"

    "No, on the contrary…"

    "So," Socrates continued, "You want to tell me something bad about him, but you're not certain it's true.  You may still pass the test though, because there's one filter left.  The third filter is Usefulness.  Is what you want to tell me about my friend going to be useful to me?"

    "No, not really."

    "Well," concluded Socrates, "If what you want to tell me is neither true, nor good, nor even useful … then why tell it to me at all?"


    How Does That Apply to Me or Trading?
     090501 Glasses Pen and Paper 200p The concept of Socrates' Triple Filter applies to trading as well.

    As a technical trader, rather than looking at fundamental data and scouring the news daily, I focus on developing dynamic and adaptive systems and processes to look at the universe of trading algorithms to identify which are in-phase and likely to perform well in the current market environment.

    One of the arguments in favor of technical analysis is that fundamental data, news, and sentiment are already built-in to the chart.


    Filter Out What Isn't Good For You.
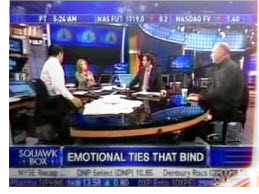
    Cnbc_sqawkbox In contrast, there are too many ways that the media (meaning the techniques, graphics, music, etc.), the people reporting it, and even the news itself, appeals to the fear and greed of human nature.

    This is the main reason that I don't watch CNBC during the trading day.  Even though I like it on several levels … I don't think it helps me.  So I filter it and get the news in other ways.

    Likewise, I don't watch TV news anymore either. It seems like story after story is about terrible things. For example during a recent visit with my mother, I listened to her watch the news.  There was a constant stream of "oh no," or "oh my," and "that's terrible". You don't even have to watch the news to know what it says.

     
    Focus On What You Want.

    Instead, I get the news I need a different way that is more efficient and productive for me. I subscribe to certain things via e-mail, and other things via RSS feeds.  Then I supplement those with a series of search services that alert me to items that match the criteria I set. An example would be Google Alerts.  Two other nice alert services are from the Financial Times and the New York Times.  Recently I've also been using two great iPad apps – one is called Flipboard, the other is called Zite.

    Check them out.  It will save you a lot of time and effort.

    Personally, I care about the source of my news. It helps me identify and account for potential bias. So using subscriptions, feed readers, and alert services help here too.

    Another reason I like these tools is that I can use different filters for different purposes.


    What's The Purpose Of News For You?

    My purpose changes what I'm looking for and the amount of attention I pay to different types of information. Am I reading or watching the news for entertainment, to learn something new, or to find something relevant and actionable?

    Getting back to Socrates' three filters and the business of trading, I ask might: is it important, does it affect our edge, or can I use it as a catalyst for innovation?
  • Six-Month Seasonality Still Unfavorable

    Is it safe to get back in the Market?
    According to popular trading rules, May 1st marked the beginning of a 6-month period of unfavorable seasonality. This is often referred to as "Sell-In-May-and-Go-Away".
    Research published by Yale Hirsch in the Trader's Almanac shows that the market year is often broken into two six-month seasonality periods.
    • From May 1 through October 31 seasonality is unfavorable, and the market most often finishes lower than it was at the beginning of the period.
    • The period from November 1 through April 30 is seasonally favorable, and the market most often finishes the period higher. (See Sy Harding's book, Riding the Bear, for an indepth discussion of this subject.)

    While the statistical average results for these two periods are quite compelling, trying to ride the market in real-time in hopes of capturing these results is not always as easy as it sounds.


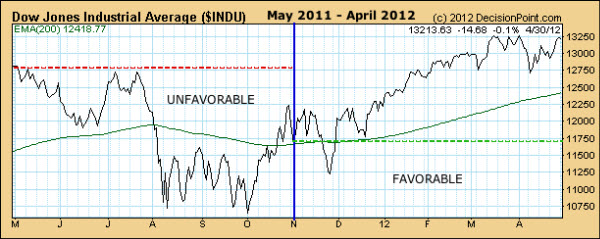
    Below is the one-year chart that that shows the most recent two six-month periods. It begins on May 1, 2011 and ends on April 30, 2012.


    120705 Periods of Seasonal Strength and Weakness

    via Carl Swenlin


    The left half of the chart shows the unfavorable May through October period and the right half shows the favorable November through April period. The green line marks the beginning of the favorable period, the red line marks the beginning of the unfavorable period.


    As you can see, the last two seasonality periods turned in textbook performance, with the unfavorable period closing lower, and the favorable period closing higher. However, every year is different and presents its own challenges … and there is no guarantee that any given period will conform to the average.


    In addition, Swenlin asserts that bull and bear market pressures override seasonal tendencies more often than not. 


    With the election coming, we'll see whether things look better moving into the end of October.


    Enhanced by Zemanta
  • Understanding Trading Patterns – Part 2

    110220 Traders In the first part of this series, we discussed that a Market is a collection of separate traders, and much of the analysis done to get a trading edge is really just a way to identify "who is in control" and what they are doing … rather why they are trading.

    Here we will examine why some traders rely on certain patterns to identify favorable trading conditions.

    Some Patterns Are Logical.

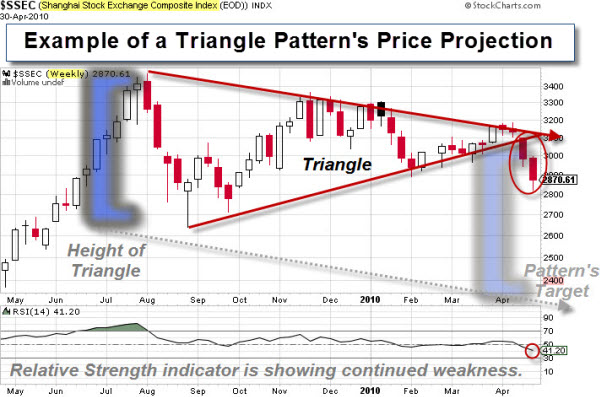
    Let's look at a common trading pattern, called a "Triangle".  You can think of the Triangle as a well-contested battle between the bulls and the bears.  It is almost like an arm-wrestling match. Inside the pattern, neither side gives-up much ground.  However, when one side loses conviction, the market  surges in the direction the winners push it. 

    Here is a picture of a Triangle and the pattern's likely price projection.


    110219 Example Triangle Pattern  

    Triangles are an example of a logical pattern.  It is easy to see, and easy to understand.  In addition, for a trader, it is easy to use a setup, like this, to define the likely risk and reward of a trade they are considering.


    Why Do Patterns Form in Markets Repeatedly?  The Answer is Human Nature.


    Markets are not always logical.  Some would argue that Markets are rarely logical.

    On some level, markets represent the collective thoughts and emotions of its participants. So, even though conditions change, the collective response to fear and greed remains reasonably similar.

    As a result, many patterns show up in market price data.


    In General, Here's What Is Happening.


    A move up of a certain degree will be met with some people who are afraid the move won't go higher … so they decide to sell.  Meanwhile, others will believe the move will trigger a whole different group of people to recognize an opportunity … so they decide to buy.

    The same thing happens with a big move down. At first, it triggers fear and selling. But at some point, to a certain group of traders, the move down will look like a discounted buying opportunity.

    At its core, price is the primary indicator of investors' willingness to buy or sell. Things like velocity or slope are secondary, and show the intensity of their motivation.

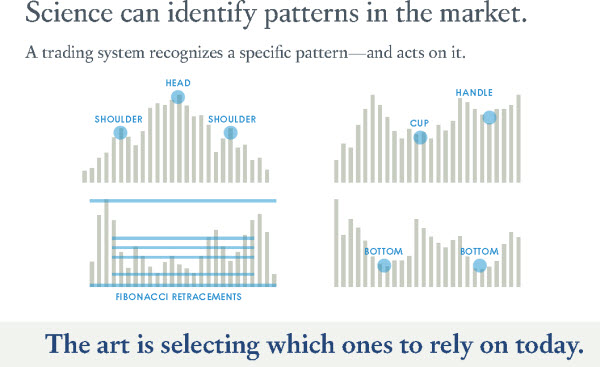
    So, many of the patterns that you read in books or magazines (with names like "head and shoulders", or "cup and handle", or "double bottoms") are all really just ways of explaining the natural response to certain conditions.


    110219 Trading Pattern Art and Science  

    There is science involved in recognizing a specific pattern; and there is art involved in selecting which pattern to rely on today.


    But You Don't Have to Predict Anyone's Action – All It Takes Is An Intelligent Response.


    It's the law of large numbers. An insurance company doesn't have to accurately predict when any individual will die; their actuaries just have to figure out a reasonable estimate of how many people will die during a certain time period. Likewise, in the market, patterns don't predict what an individual will do, only what the majority is likely to do.

    So now that you understand patterns, the rest is easy … right?


    Fractals and Holograms.


    110220 Fractal Of course it's not as easy as it sounds, because these patterns are being played out across every market, and happen on different time frames as well. That means some people are responding to the market using a much longer time horizon than someone else. A pattern for them may be noise at a different level of focus.

    The patterns occur similarly whether you're looking at be minute by minute chart of the S&P, or a weekly chart of gold.

    Since there are many patterns happening on many markets at any given time, it's impossible for a human to identify, validate, and trade all of them in real-time.

    That's where technology comes in. And that is what we'll look at in the next article in this series.

    Hope it helped.  Let me know if you have questions or comments.


    Enhanced by Zemanta

  • An Explanation of Why Pattern Recognition Works in Trading

    While some people believe that markets are random, others make money by using rule-based trading systems that rely on certain patterns to identify favorable trading conditions.

    Traders, at every level, search for a tradable edge. Some find it in fundamental analysis; others find it in technical analysis or chart-based patterns; still others find an algorithmic or execution-based edge.

    So, is there some magic unifying equation that defines the Market?  Personally, I doubt it.  However, there is always "something" working in the markets.  The challenge is to identify what that is and to ignore the rest. 

    Though many many patterns work, from time-to-time, when a particular pattern comes into play may seem random; and here is why.


    Understanding the Markets.

     
    110129 CME SP500 Trading PitThere is no such thing as a "Market" … It is really just a collection of separate traders.

    One of the reasons that markets experience great volatility is that different groups buy or sell for different reasons at different times.

    Consequently, even if one group trades using a consistent set of rules, a strategy that effectively combats it only works until that group stops trading those rules.

     
    Elephants Leave Tracks.


    110129-Elephant-Tracks Smart traders follow the big money.

    Large traders like governments, sovereign wealth funds, or a mutual fund can affect markets while they buy or sell.

    However, when they're done, some other group's strategy becomes the dominant force.

    Experienced traders recognize that it is important to understand "who is in control"  … not necessarily why they are trading.

    That means you don't have to figure out every bit of information or rationale behind their strategy in order to make money. For example, if you were about to walk into a movie theater, but were suddenly confronted with hundreds of people running in the other direction screaming, you don't have to understand exactly why it's happening in order to respond intelligently.


    110129-Running-For-The-Exit 
    On a superficial level, that's the basis of trend following.  It is also an example of pattern recognition.

    Most hedge funds now use some form of pattern recognition in their trading systems. In the next article, I'll delve into this topic a little more deeply.

    Enhanced by Zemanta

  • Who’s Going to the Trader Expo in Dallas?

    Join David Stendahl, portfolio manager at Capitalogix, at the Traders Expo in Dallas Texas June 6 – 8.


    120429 Dallas Traders Expo  

    David will be talking about effective way to build diversified futures portfolios. Click here for more information.

    I'll be there too.  Let me know if you're going … looking forward to seeing you at the Expo.

    Enhanced by Zemanta
  • Michael Covel’s Trend Commandments

    Michael Covel was the keynote speaker at this year's Market Technicians Association Annual Symposium.

    Covel has made a name for himself as a chronicler of the Turtle Trading experiment and an outspoken proponent of trend following.  Here is a photo of him and me at the Symposium.


    120427 Michael Covel and Howard Getson at the MTA Symposium  

    Truth be told, I often sit through presentations at a trading conference feeling skeptical, and looking for an idea that rings true or at least seems worth investigating further. 

    This was much better than that.

    Covel claims that market profit is about the right mentoring and practice, not genetic gifts, inborn talents, or Asperger's memory brilliance.  You simply need a winning philosophy and strategy, backed by proven positive results that you can execute.

    Unlike some industry experts who hint at elusive secrets, Covel's unabashedly open about what he believes works and the things that he's learned from winning traders. He also sprinkles in wisdom from the ages, like this quote from the ancient Greek trend follower, Epictetus.

    Do not strive for things occurring to occur as you wish, but wish the things occurring as they occur, and you will flow well.

    The audience at an MTA event is filled with an impressive group of people … you'll meet portfolio managers, strategists, analysts, quants, and traders who rely on technical analysis. Talk of oscillators, histograms and regression testing fills the air. So, it was refreshing to hear Covel challenge the room. Covel loves to poke technicians who talk about quant trading; he claims that systematic trend following is the only quant strategy that actually works.

    He said that what he does is real technical analysis because despite what anyone else thinks, he's skeptical that any of the complex strategies being discussed consistently beats the technique he's talking about. The proof, he says, is in the evidence. In this case, it's the detailed trading records of dozens of systematic trend traders who have produced consistent results that dramatically outperform the markets, year-in-and-year-out for decades.

    Simple Is Often Better.

    If you asked someone who builds trading systems to describe a trading system, they'd probably focus on inputs and technique (e.g., what indicators does it use; is it a momentum strategy; does it seek to profit from artbitrage, reversion to the mean; does it use a simple crossover technique?). In contrast, Covel starts with a proverb:

    If you must play, decide upon three things at the start: the rules of the game, the stakes, and quitting time.

    Going a little deeper, Covel says a system should confidently deal with these questions.

    1. What market do you buy or sell at any time?
    2. How much of a market do you buy or sell at any time?
    3. When do you buy or sell a market?
    4. When do you get out of a losing position?
    5. When do you get out of a winning position?

    However, he cautions that trend following starts with knowing when to do nothing. If the market is screaming like a spoiled brat … Step to the side. That’s your first play. Cash is a legitimate position.

    Learning More.

    Covel is an engaging speaker and writer. In addition to the keynote, I had an opportunity to sit down with him and have a real conversation. I'm happy to say that he has a terrific grasp on trading, traders, and an interesting perspective on what works.

    120427 Trend Commandments BookCovel has a new book called Trend Commandments: Trading for Exceptional Returns. He claims it is for those who know deep down that there is a real way to make money in the markets, but just do not know how yet. 

    As a result of our conversation, I bought a copy. Since I had already read several of his other books, including Trend Following and The Complete Turtle Trader, I didn't expect much new information.  However, just as he promised, this book has a different tone and is chock-full of insights and tradable ideas.

    If your're curious, here's my post on his earlier books.

    Covel offers an interesting collection of Podcasts. Click here to check them out.

    And, here is the slide he ends with.
    • Do not run with the pack.
    • Collaborate with meaningful people.
    • Be guided by beauty. It is a beautiful thing to solve problems and do things right. 
    • Do not give up.
    • Hope for some good luck.

    Sounds good.

    Enhanced by Zemanta
  • Sector Rotation Shows Defensive Posture – Even Though Earnings Are Strong

    One of the ways to measure the mood of the stock market is to see what sector rotations are taking place beneath the surface.

    This chart shows that sector rotations over the past month reflect a market mood that is turning more defensive.


    120422 Sector Rotation

    John Murphy explains:


    The four sector lines are plotted "relative" to the S&P 500 which is the flat black line. In other words, the four sector lines are relative strength ratios that measure their performance "relative" to the S&P 500.

    The blue line shows the Technology SPDR (XLK) leading the market higher since the beginning of the year. Technology leadership is a good thing for the market. The XLK:SPX ratio has started to drop during April, however, which shows short-term loss of that leadership. In fact, technology was this week's weakest sector.

    The other three lines show the relative performance of the three defensive sectors which are consumer staples (pink line), healthcare (green line), and utilities (red line).

    Those three sectors underperformed the S&P 500 since December as the market rallied. Notice, however, that those three relative strength ratios have turned up over the last month. In fact, utilities, healthcare, and staples were this week's three strongest sectors.

    That's normally a sign that investors are turning more defensive and are protecting themselves from a possible market correction.


    Meanwhile, Q1 Earnings Season got off to a good start as companies continue to surprise with strong revenue and earnings.


    120423 Q1 Earnings Off to a Good Start

    via Bespoke.


    Enhanced by Zemanta