
As I edit this post, I’m eating a Reese’s peanut butter cup that survived last night’s onslaught of trick-or-treaters (perhaps because some of them were in a backup container in my office … you know, in case we ran out of other candy…). So, when I saw this Halloween-themed infographic, I thought: “Good, but it probably needs a taste test.”
Good data visualizations are few and far between. Bad data visualizations spread lies, misrepresent content, or are sometimes just plain unreadable.
In honor of Halloween, here’s a fun data visualization by Mariona Banyeres, based on FiveThirtyEight’s “The Ultimate Halloween candy power ranking.” It’s a few years out of date, but I think we can let that slide. Compared to simpler charts, it may be harder to read – but it’s interactive, it’s themed, and if you hover over points, it will add extra context. Click to go to Mariona’s interactive Tableau DataViz.
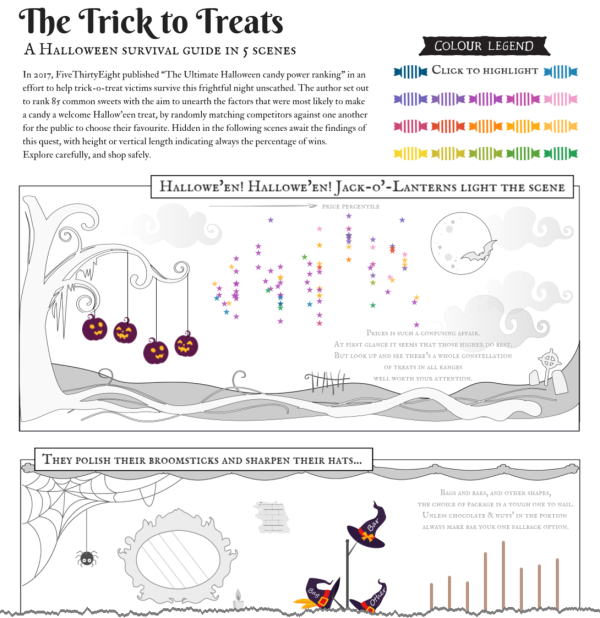
Mariona Banyeres via FiveThirtyEight
To skip the data visualization, here are the results of FiveThirtyEight’s competition.
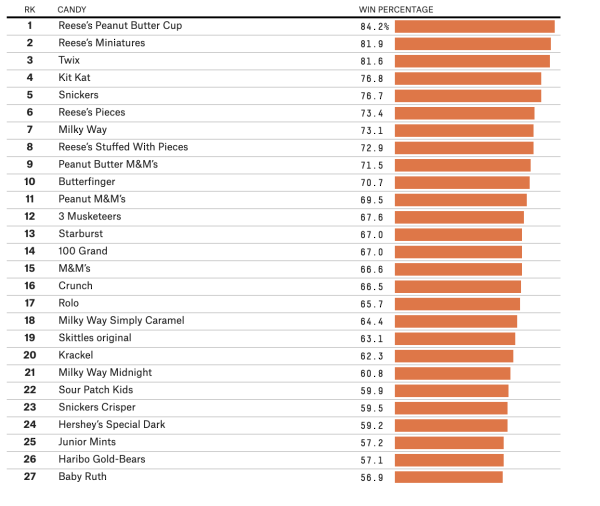
via FiveThirtyEight
I hope you had a happy Halloween, and I hope you were the house that helped others have a happy Halloween, too. Either way, I hope your treats passed the taste test.
Leave a Reply