With Facebook's IPO set to happen soon, I was thinking about some of the other big tech IPOs.
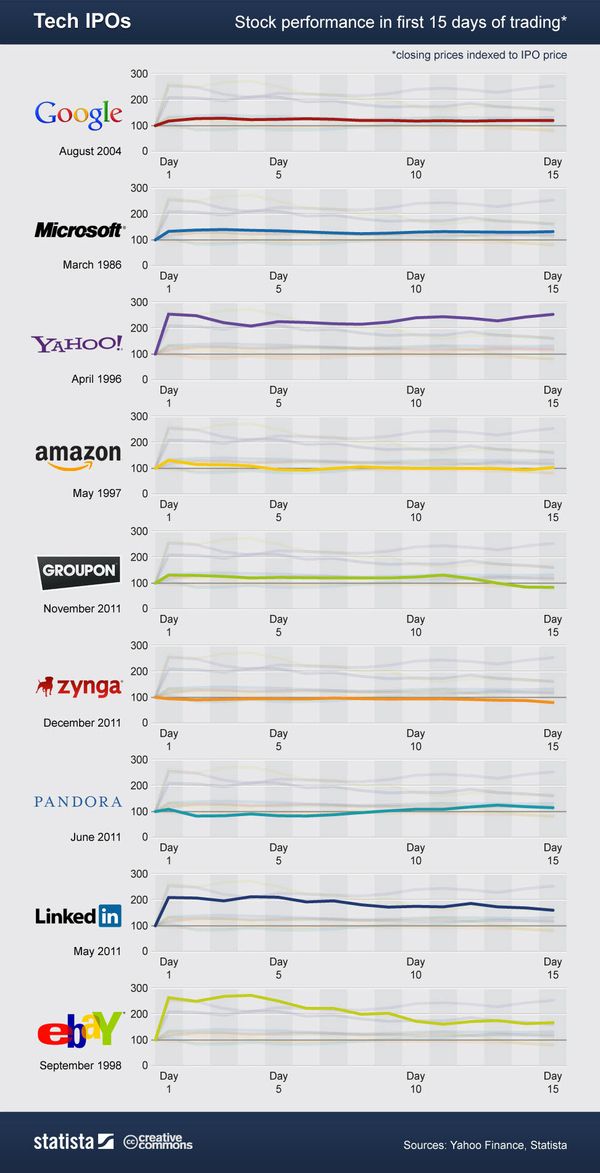
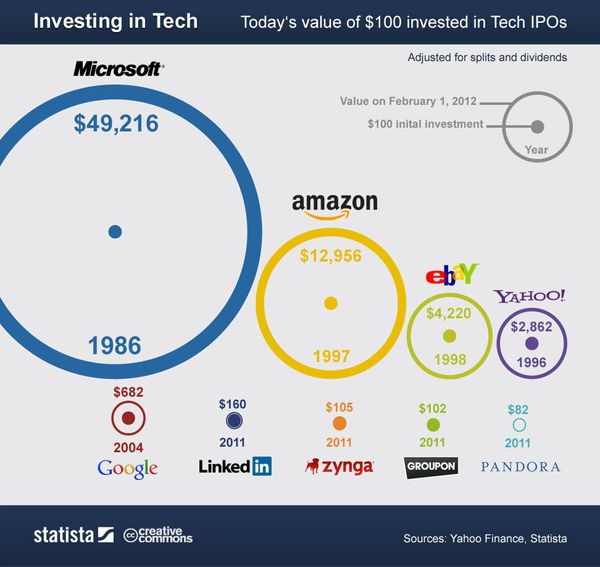
The first few weeks of trading may not be a good estimate of how successful a company will be over time. The charts below, from a Mashable post showing how nine tech giants did after going public, highlight that point.
First, here is a normalized index chart showing the initial 15 days of trading for each company.

Second, here is a chart showing growth to date. This chart illustrates how much a $100 investment, at the IPO price, would be worth today.

Some of those returns are surprising, aren't they?


Leave a Reply to reg arb Cancel reply