October 2009

  • Sparks of Innovation

    Here is a video reminder that a small insight can make possible radically different results.

    Was this just a proof of concept … or will it be the catalyst to more.  To some it might be little more than science fiction … to others it may have been the open door to something completely new and different.

    Thoughts Do Become Things

    Here is an example where a simple text-book idea really transformed lives.  And it is a good story.

    William Kamkwamba, from Malawi, is a born inventor. When he was 14, he built an electricity-producing windmill from spare parts and scrap, working from rough plans he found in a library book called "Using Energy" and modifying them to fit his needs. The windmill he built powers four lights and two radios in his family home. Now it is changing his homeland.

    Here is a link to more about William Kamkwamba and his TedTalk Videos.

    Here is a link to the book: The Boy Who Harnessed the Wind: Creating Currents of Electricity and Hope.

  • The Game Is Changing

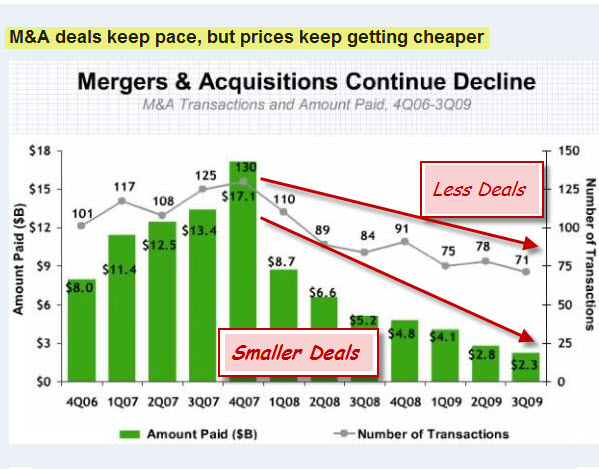
    Mergers and Acquisitions are likely to increase before the next big bull run.  This chart shows that we aren't there yet.

     091011 Decline in Merger and Acquisition Activity

    We're at the point in the economic recovery cycle where a lot of companies have folded, or will soon fold. On the other hand, the survivors are starting to see the clearing … or at least the light at the end of the tunnel. Consequently, I expect to see more merger and acquisition activity at the next pull-back.

    This will help the strong get stronger … But it will also serve as a catalyst to new growth and new leaders.

    M&A Isn't the Only Way.

    This is a great environment to incubate what comes next. During downturns, some people lose their money, business, or hope. During that same period, other people recognize and seize the opportunity to create something great.

    There so much talent on the street right now looking for work … yet there is even more looking for something that inspires them.

    At the same time, technology continues to
    get better. And that just means it continues to get cheaper and easier to implement
    great ideas and scalable businesses.

    Consequently, I think a lot of talent is going to switch from the confines of
    corporate America to more entrepreneurial ventures. Bright minds will
    shed cost-cutting cultures and management-by-committee for virtual
    teams of talented individuals looking to innovate and operate more
    nimbly.

    Something Old is New Again.

    Sometimes new things come from familiar faces.  There are many
    successful entrepreneurs who have been to the brink, and back. What's
    interesting is that
    they tend to succeed faster, later in their
    careers. It makes sense if you think about it; losing money or facing a
    setback doesn't take away the other skills that they had … so their
    next venture is easier for them simply because they
    are more experienced and better seasoned.

    Nonetheless, I'm confident that we will soon see a new wave of
    the business leaders emerge. I'm curious who you think the likely winners will be?

  • Capitalogix Commentary 10/11/09

    This was a good week for bullish traders.  Sure volume was light for the rally.  But selling was even lighter.  In a trending market, thinking too much can be detrimental to your wallet.  And from March until now, the trend points up.

    What Does the Bigger Picture Show?

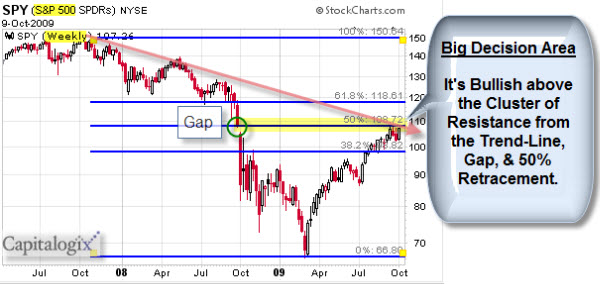
    A weekly chart of the SPY, which is the ETF for the S&P 500, shows price coming into a cluster of resistance.  There are three things that jump out at me.  First, we are at the 50% Retracement of the October 2007 to March 2009 downswing.  Second, price is also are trying to break through the long-term downtrend line from that bear swing.  And third, there is a significant Gap (which often acts as resistance) at that same level from last October.

    091011 SP500 Decision Cluster

    The good news is a move above this level would be quite bullish.

    Can We Move Higher?

    The market does not directly reflect the economy.  So price can go
    higher, even without a real economic recovery.  For traders, the
    question is how long the rally will be sustainable?  The answer is
    simple; it is sustainable until price breaks the trendline. 

    It is a little tricky, here, because we have the battle of two trendlines. 

    What About the Economy?

    As for the economy, consumer spending has been weak, so expect that corporate revenues will continue to drag. And companies straining to realize their inflated expectations for 2010-11 earnings will continue to focus on cutting costs, which translates into cutting jobs.  Unfortunately this likely results in even less consumer spending …

    Where Are Consumers Spending?

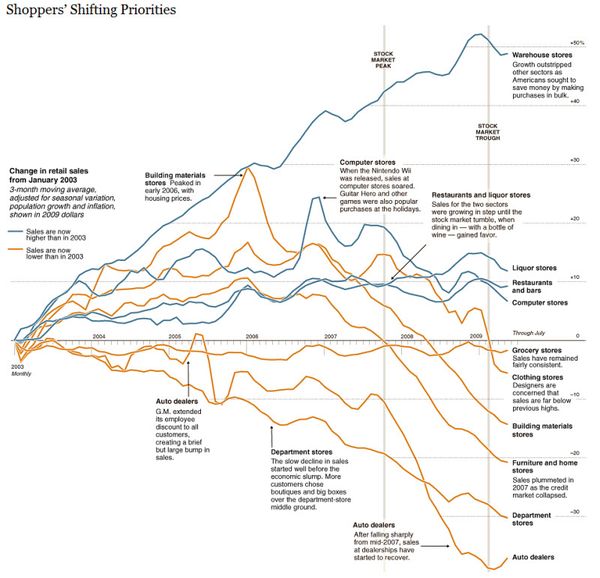
    This chart from the New York Times tells an important story.  It shows where consumers are spending … and where they aren't.  Last year, consumers pulled back on spending and the retail sector suffered. But not all retailers are faring worse than they did a few years ago. 

    Against a baseline of spending levels in 2003, sales in computer stores have continued to rise. Restaurant and liquor-store sales are at much higher levels, and purchases at warehouse stores are up nearly 50 percent.

    Still, in major retail divisions like home furnishings and clothing, sales faltered in 2007 and are now below their levels of 2003.

    091011 Where Shoppers Spend

    Does a Weak Dollar Matter?

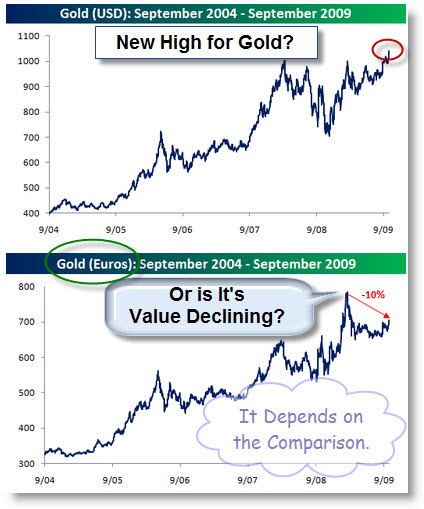
    This chart series from Bespoke highlights one reason that a weak dollar matters.  While gold is at record highs in dollar terms, the commodity is still down 10% from its highs when priced in Euros or Yen.  This indicates that the strength is a function of a weaker dollar rather than a real increase from demand.

    091011 Gold ValueThe same logic applies to the recent market rally.  If the dollar gets stronger, expect the market to move down.  Consequently, many traders are watching the dollar as it tries to bottom.

    Business Posts Moving the Markets that I Found Interesting This Week:

    • What's Luck Got to Do With It? The Math of Gambling. (NewScientist)
    • Women, Testosterone & Finance – Risky Business? (Economist)
    • Private Equity's Return Dilemma – Hope Dwindling for a New Buyout Boom.(WSJ)
    • Please Do Feed the Bears – The Financial World Needs Its Pessimists. (Economist)
    • Return of Day Traders Drives Volume; But Who Is Sitting-Out? (WSJ)
    • Uncommonly Clever Economic Indicators. (Forbes)
    • More Posts Moving the Markets.

    Lighter Ideas and Fun Links that I Found Interesting This Week

    • Microsoft Offers Free Security Essentials Anti-malware Package. (InformationWeek)
    • More Cases of Autism in U.S. Kids Than Previously Realized. (CNN)
    • A Credible Kindle Killer? Competitors Team-up to Take on Amazon. (Forbes)
    • Tracing the Origins of Human Empathy. (WSJ)
    • Allocate Hours for Maximum Productivity in Your Perfect Day. (ETR)
    • Samurai Mind Training for Modern American Warriors. (Time)
    • More Posts with Lighter Ideas and Fun Links.

  • Brazil’s Campaign Video

    If you're still trying to figure out why Chicago lost the Olympic bid, this RIO 2016 commercial might explain it. 

    Nicely done; short and compelling.  It certainly makes me want to visit.

  • Brazil’s Campaign Video

    If you're still trying to figure out why Chicago lost the Olympic bid, this RIO 2016 commercial might explain it. 

    Nicely done; short and compelling.  It certainly makes me want to visit.

  • Capitalogix Commentary 10/04/09

    The Trend Is Up; So Discipline Says Buy the Dip.

    Most of the U.S. Equity Indices (Dow, S&P 500, Russell 2000 and the MidCap Index) have pulled-back to their 50-Day moving averages and short-term support.  So have many sectors, including: Financials, Metals, Energy, Drugs, Materials, and Consumer Discretionary.  This would be a likely place for bulls, looking for a continued rally, to put some extra cash to work in the markets by buying the dip.
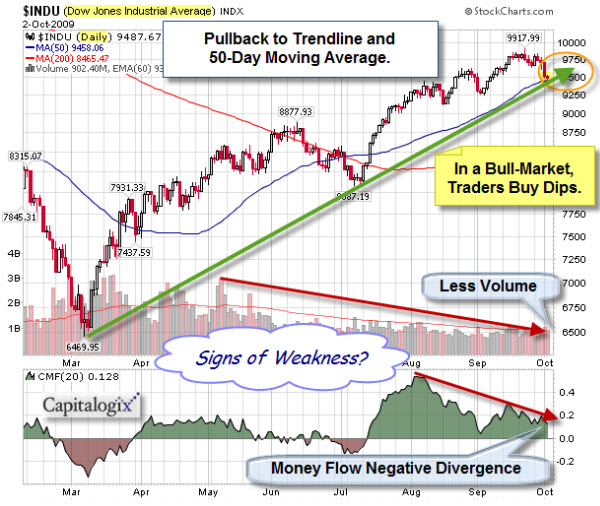
     091004 Buying the Dip on the Dow

    Tech is still leading the rally.  So I'm watching that area closely for continued strength.  A lack of buying here is a warning sign.

    The Market Is Getting Jiggy.

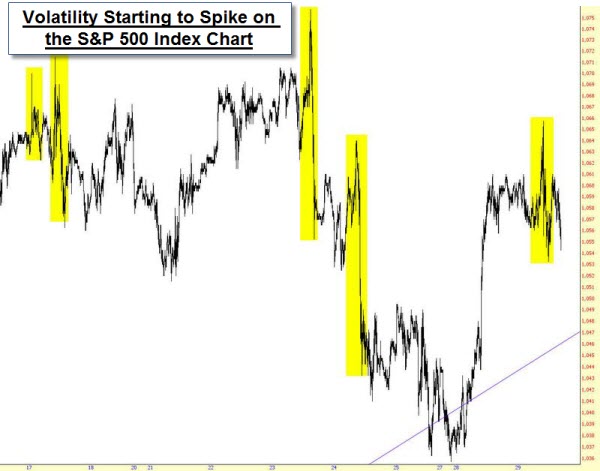
    One thing tempering my confidence in the "buy the dip" strategy is that I noticed a lot more "mischief-bars" recently.  These head-fake moves show-up on charts as jaggy spikes, and often shake-out weak holders … only to reverse sharply.  Here is a chart of the S&P 500 from Tim Knight's Slope of Hope site.  The yellow sections highlight areas where it is easy to see the spikes in volatility. 

     091003 SP500 Starting to Show Volatility Spikes

    This type of behavior often happens near major trend changes, and reflects the disagreement between bulls and bears.

    Does the Recent Weekly Buying Climax Signal Exhaustion?

    For those looking for further evidence of a turning point, Investors Intelligence recently released a chart showing major buy and sell climaxes in the S&P 500.  As you can see, they often come at major turning points for the markets.  The Blue Bars show Weekly Buying Climaxes, which occur when a stock makes a 52-week high and
    then closes lower for the week. This represents distribution from strong
    hands to weak ones and most often occur around market highs.  And the Red Bars mark Weekly Selling Climaxes, which occur when a stock makes a 52-week low and
    then closes higher for the week. This represents distribution from weak
    hands to strong ones and most often occur around market lows. 
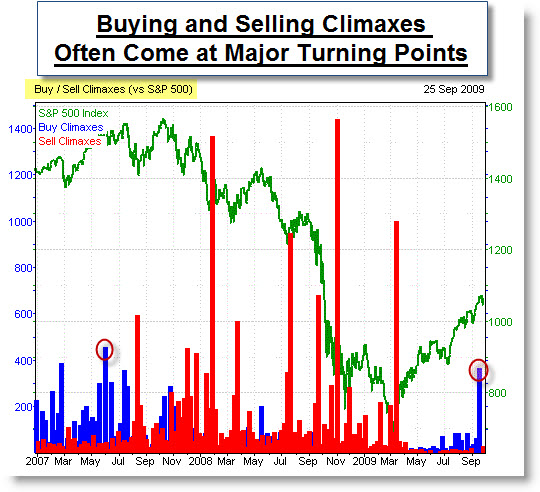
     091003 Buying Climax Could Signal Trend Change

    This chart shows that there were 380 total Weekly Buying Climaxes as of the end of last week (see the blue bar at the bottom right of the chart). This was the highest buying total since June 2007 (which is the blue bar circled in red, towards the bottom left of the chart) and eclipses the extreme reached at the October 2007 top. Investors Intelligence notes, that after four months, climax signals for those who sell into buying climaxes and buy into selling climaxes are correct about 80 percent of the time. So another indicator has flashed a “warning” that suggests we be especially attentive to a trend change.

    Employment Numbers.

    Of course the other thing weighing down the hopes of economic recovery is unemployment.  The numbers haven't been improving.  Moreover, I expect to start hearing about the next wave of big cuts (that cut muscle, and not just corporate fat). Recent quarterly results showing corporate profits were often based on cost-cutting, which may not be sustainable. Revenue is a more telling indicator.
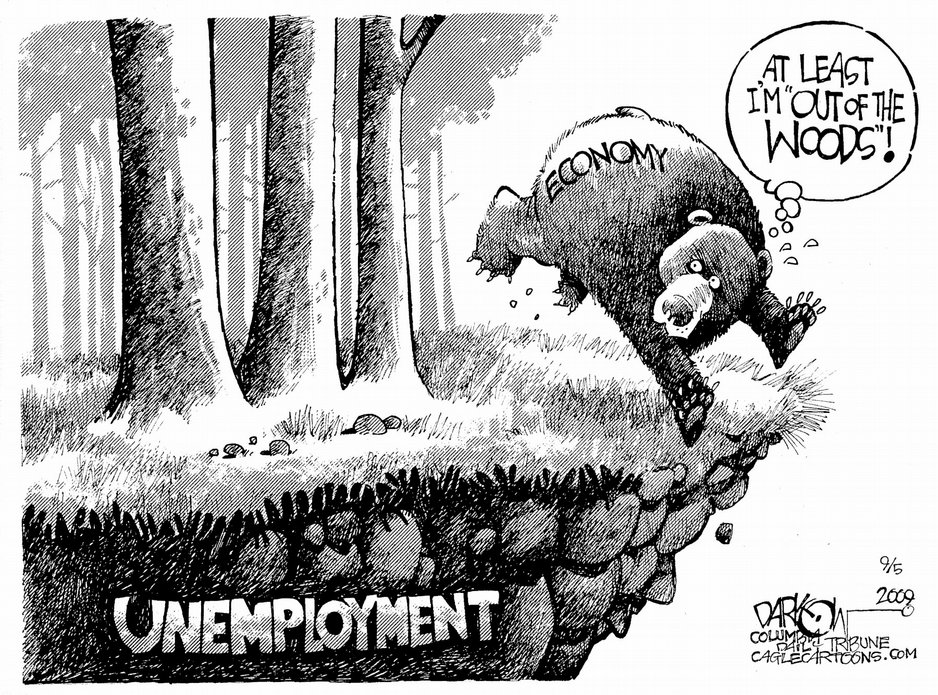
     Sat_Edit_Darkow_090509_t938

    This is something that bears watching.  The next topic bears watching too.

    All You Need to Know About High Frequency Trading.

    Here is a short video from the Jon Stewart Show.  It portrays High-Frequency Trading in a less than flattering light. It was funny; yet made some non-trivial points.

    The Daily Show With Jon Stewart Mon – Thurs 11p / 10c
    Cash Cow – High-Frequency Trading
    www.thedailyshow.com
    Daily Show
    Full Episodes
    Political Humor Ron Paul Interview

    Ultimately I believe that innovation and intelligence can lead to competitive advantage. And, generally, that is a good thing. However, even a good thing can be taken too far. This is an area that needs some common-sense legislation and oversight. High Frequency Trading makes it too easy to manipulate price and markets.

    Business Posts Moving the Markets that I Found Interesting This Week:

    • S&P Says Stock Buybacks At Lowest Level On Record. (StreetInsider)
    • Is Wall Street Taking a Chance on Risk, Again. (DealBook)
    • Fretful Investors Sidelined by Rally. (WSJ)
    • Kass – Pokes Some Fun at the "Dumb Money" Behind the Rally. (TheStreet)
    • More Than Half of Residential Mortgages Made by Just 3 Large Banks. (WSJ)
    • If Lehman Hadn't Failed, Would the Crisis Have Happened Anyway? (Economist)
    • More Posts Moving the Markets.

    Lighter Ideas and Fun Links that I Found Interesting This Week

    • Did Kindle edition of Dan Brown's 'Lost Symbol' Out-Sell Hardcover Editions? (WSJ)
    • The "Lost Symbol" Shines Spotlight on Freemasons in Washington. (USNews)
    • Leading Research Universities Launch Futurity Online Research Portal. (Duke)
    • Simplifying Supplements: Modern Diet is Energy Rich, Yet Nutrient Poor. (Ode)
    • Four Things that May Sabotage Your Weight-Loss (USNews)
    • Business Intelligence Gives Way to Operational Intelligence. (Forbes)
    • More Posts with Lighter Ideas and Fun Links.

  • How To Keep Track of the National Debt

    The Big Red Calculator.

    I've known Matt Miles for years; and he does what's necessary to make a point.  He is also a smart and successful entrepreneur.  The result, a new company called Big Red, that makes a calculator with enough digits to display the national debt.

    In his own words: "The Big Red Calculator, a 16-digit calculator, makes your old calculator extinct!  First we owed millions.  Then it was billions!   And now-thanks to those wonderful people who brought you deficit spending, we've shattered the trillion-dollar ceiling.  It truly is a proud moment.  But how can the average American keep track of such an incomprehensible number?  The answer is Big Red Calculator.  It is  "the official calculator of the national debt".  Endorsed by professional spenders! Ensuring that "no digit is left behind",  this calculator displays the largest collection of zeros ever assembled."  Yes, you can buy one at Amazon.