It seems like everywhere I look, there is bad news about the economy. Recently, however, venture capital and M&A activities have been picking-up. Both of those are early indicators of economic optimism. In addition, here are two other signs that economic winter may soon give way to spring.
 First, a Bankruptcy Partner in a major Dallas law firm just told me that he sees fewer filings in the pipeline. In addition, he says that credit has started opening-up to corporations, which is giving them the lifeline they need to start making progress again.
Second, speaker bookings for corporate meetings seem to be picking-up again. I suspect that this is an indicator that corporations are willing to spend money on motivation, teamwork, and culture. In Maslow's hierarchy of needs, that's certainly a tier above food and shelter. In other words, when money frees-up for these types of activities, it suggests that corporations are starting to feel more comfortable about the short-term … and more optimistic about the longer-term.
From a technical analysis perspective, optimism shows itself in the charts.
Where Are We?
In last week's commentary, I indicated that a
holiday-shortened options expiration week was a likely time to expect a
bounce. Well, even though the Fed announced a surprise discount rate hike to banks,
the markets did rally. While impressive on some levels, it happened on
low trading volume and takes us to a resistance level.
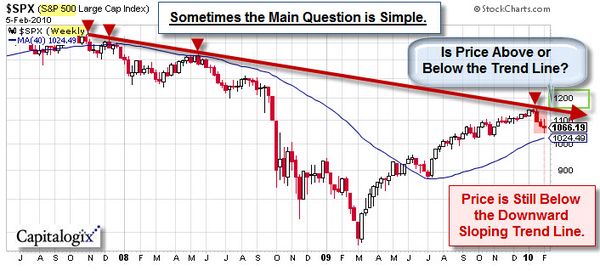
It is
decision-time for the S&P 500 Index. The weekly chart, below, shows
the downward sloping trend-line from the 2007 highs, as well as the
rally off the 2009 lows. More recently, we've seen a nice rally off the
high volume reversal bar from several weeks ago (marked by the yellow
highlight in the green circle). Nonetheless, the bigger issue is whether price will be
able to rally and hold above the down-trend line (marked by the
red arrow)?

If the markets do sell-off soon, then many eyes will shift to the 200-day moving average (similar to the 40-week average marked in blue) as a likely support level.
It Is a Matter of Perspective … But the Real Story is the Lack of Selling.
I read an article that claims to outline the three basic causes of the market rally since March of 2009.
- The first is that the Fed has recently chosen to pump liquidity into the financial systems during options expiration week.
- The second is that markets closed higher on approximately 75% of Monday's since the recent market low (with 80% of the gains, since those lows, happening on Mondays).
- The third is that virtually all of the Q4 2009 market gains occurred in the overnight futures session, when US markets are closed.
The chart, below shows the gains and losses that occurred during the normal trading session versus during after-hours sessions.

My first reaction was that this probably was the result of government
action or manipulation by some unseen hand. Pushing the market higher
during light futures trading periods (like weekends or after-hours)
resulted in bigger gap-up openings.
After a little thought, however,
these actions make sense. Even if these after-hour pushes were the
result of the government, it was easier, took less capital (and thus
cost less to do it) after-hours than it would have during periods of
thicker trading. So, it was smart to do it that way.
More importantly,
this is a free market; so if the market "disagrees" with the push
higher, then sellers can freely take their profits or positions. The
bigger issue is that even though the markets have been pushed higher, we
still haven't gotten to the point that triggers selling volume.
Business Posts Moving the Markets that I Found Interesting This Week:
- Fed Raises Rates to Banks; Signals Pivot to Normal Policy. (NYTimes & MarketWatch)
- Which Banks Are Worth Betting-On During the Recovery? (WSJ)
- Bailout Hustle: Banks Pocketing Trillions & Re-Creating
Conditions
For Crash. (Taibbi) - Fund Flows: Equity Investors Find the Exits Again. (BusinessInsider)
- M&A Picking-Up: Google Buys Aardvark. (InformationWeek)
- More Posts Moving the Markets.
Lighter Ideas and Fun Links that I Found Interesting This Week
- Utah Mulls Eliminating 12th Grade to
Save Money. (Newser) - Herbal Medicines Can Be Lethal, Pathologist
Warns. (MedicalNews) - Dan Ariely: Bonuses Boost Activity,
Not Quality. (Wired) - Evil
Kneber Malware Seeks to Mine Financial Data. (TechNews & PCWorld) - MetaCritic – Interesting idea.
One Place to Go for Reviews. (MetaCritic) - More Posts with Lighter Ideas and Fun Links.