Trading

  • Some Thoughts on the ‘Hindenburg Omen’ Pattern Predicting Market Instability

    Tracking the Hindenburg Omen: How Much Danger Is There?

    100815 Hindenburg CrashWarnings were heard from
    many corners of the financial blogosphere that the Hindenburg Omen triggered.

    What is it?  It is a fairly obscure technical analysis pattern, which supposedly gives an early warning of unstable market conditions (and even potentially stock market crashes).

    While the calculation is based on five factors, the primary conditions indicate that there is a big disagreement about market conditions.

    For example, two of the conditions are that a substantial number of
    stocks have to be at yearly highs, while a substantial number of stocks
    have to be at new annual lows.  Ultimately, it is hard for those two
    conditions to be met in a short period of time, unless there's
    uncertainty in the market.  Moreover, after a rally, uncertainty is
    often a precursor to a decline.

    In addition, technically (in order for the pattern to be complete), a
    second sighting of the five elements must occur within 36 days.
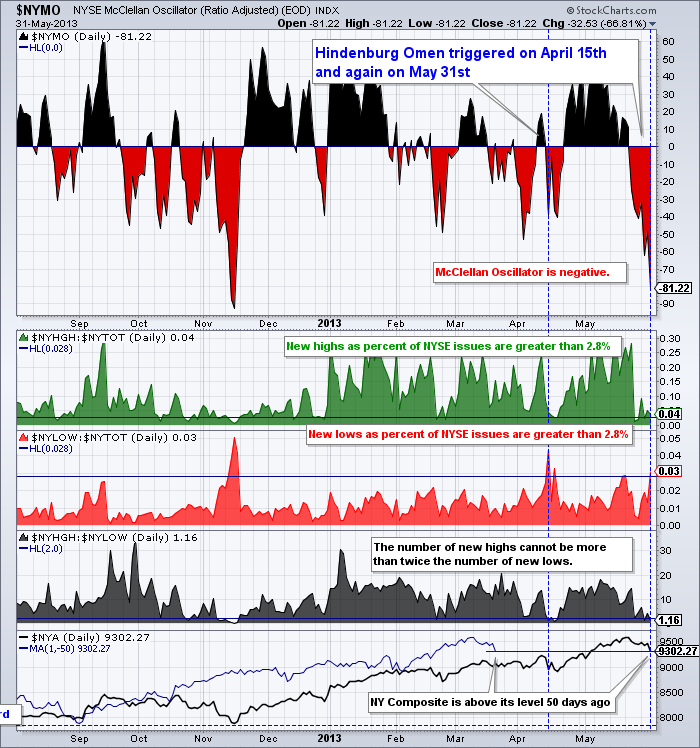
    Logically, lingering uncertainty is a momentum killer.  Well, in this case we have it; the pattern flashed in mid-April and it happend again on the last day of May.


    130602 Hindenburg Omen Chart
     

    While this pattern has correctly predicted every big stock market
    swoon of the past two decades, including the October 2008 decline (that
    set the global economic recession into motion), not every Hindenburg
    Omen has been followed by a crash. Resorting to a geometry analogy: All
    rectangles are squares, but not all squares are rectangles.

    Personally, I don't make trade decisions based solely on indicators
    like this. Nonetheless, it has a pretty good track record, seems to be
    based on reasonable theories, and might be useful as just another data point urging caution.

    Enhanced by Zemanta
  • Here Are Some Links for Your Weekend Reading

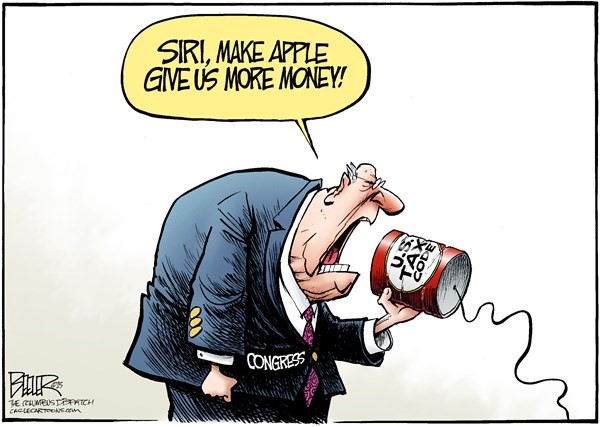
    You probably heard that Apple avoided $9.2 Billion in U.S. Taxes with its recent debt deal.  Here is one way to try and fix that …


    Siri - Make Apple Give US More Money


    Here are some of the posts that caught my eye. Hope you find something interesting.


    Lighter Links:


    Trading Links:

  • The Rally Continues, Even Though Smart Money Expected a Short-Term Top

    Traders are often confronted by mixed signals. 

    Personally, when I have to choose between something straightforward
    or something complex – simple is better.

    For example, when large "Smart Money" traders show their directional bias, it often pays to follow in their tracks.

    Another technique would be to bet against the smaller retail "Dumb
    Money" traders (because, historically, they are often wrong at major
    turning points.

    However, if I have to decide between following "Smart Money" or doing
    the opposite of what "Dumb Money" does … then in the absence of other
    information, following Smart Money wins because it is more
    straightforward and simpler.

    Here is an example.

    Smart Money – Dumb Money Confidence Index.

    The
    chart, below, compares the bets made by small traders (a.k.a. the "Dumb
    Money"), to those of large commercial hedgers (a.k.a. the "Smart
    Money").

    In practice, Confidence Index readings rarely get below
    30% or above 70% (they usually stay between 40% and 60%). When they move
    outside of those bands, it's time to pay attention.

    Even more
    noteworthy is when there is a wide confidence spread with bullish bets
    by the Dumb Money and bearish bets by the Smart Money. This type of
    sentiment spread only happens a few times a year. We often get
    substantial bullish reversals when that happens.

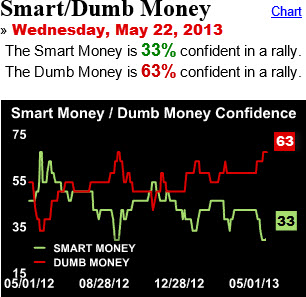
    So, early last week, I took notice of this chart from SentimentTrader. The confidence spread it shows was pretty close to extreme levels.


    130525 Smart Dumb Money Before

    Conventional trading wisdom says that Crowds are usually wrong at
    turning-points.  That doesn't mean they are wrong all the time (yet, as discussed, it makes sense to notice when the Smart Money clearly disagrees). So, after such a strong rally, this is the kind of data that causes me to pay closer attention.

    The Markets had been selling-off a litte.  Would this be  a trend-break or a buying opportunity?  Would Smart Money start actively making Bearish bets?

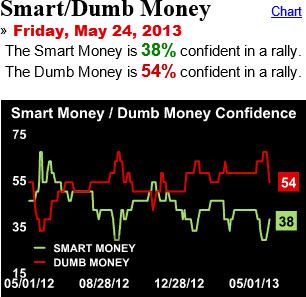
    As the next chart shows, two days was all it took to get back to the status quo.


    130525 Smart Dumb Money After


    That is why trend following works.  Price is the primary indicator, and until it breaks down, dips will be met with buying.

    Enhanced by Zemanta
  • Here Are Some Links for Your Weekend Reading

    If eating bacon really took minutes off your life … I'd be in trouble.  Good thing I don't believe conventional nutritional theories.

      
    130518 Bacon and Lifespan


    Here are some of the posts that caught my eye. Hope you find something interesting.


    Lighter Links:


    Trading Links:

  • Are You Surprised By What Has Happened in the Year After Facebook’s IPO?

    A year ago, investing in Apple and Facebook seemed like 'smart' choices.

    Back in February 2012, when Facebook announced its plans to go public, the tech world went crazy. The hype was enormous over what many believed would become one of the biggest IPOs of all time.

    On May 18, Facebook started trading at $38, giving the company an implied valuation of $104 billion. Unfortunately, what was supposed to be a sure shot investment, hasn't turned out that way.

    On its first trading day, the stock closed just above its IPO price but only thanks to the company’s underwriters, led by Morgan Stanley, who bought heavily to keep the stock above its offering price.

    The next week, Facebook’s stock began crashing, and it did so until it hit rock bottom at a price of $17.73 on September 4th. Those who had bought shares at the offering price of $38 had lost 54 percent of their initial investment in less than four months.

    After Facebook’s biggest lockup expiration in November did not trigger the feared fire sale, Facebook’s stock slowly started to recover. Carried by decent results and the introduction of mobile advertising products, the stock gradually climbed back up; but as of yesterday it was still closer to its all-time low than it is to its IPO price.

    Those who bought Facebook shares at $38 are still down 30 percent, and there are countless investments that would have yielded better results over the past year.

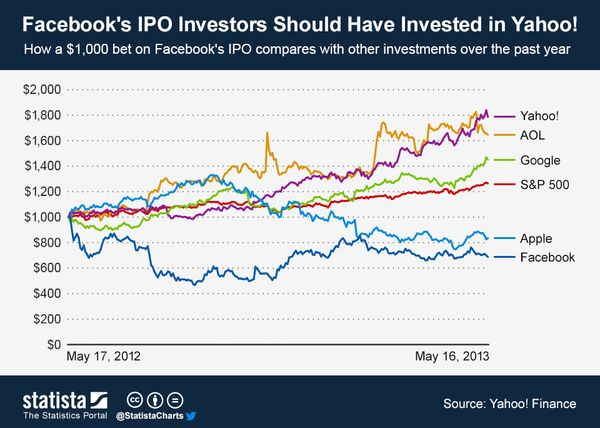
    Remarkably, even AOL and Yahoo, both Internet companies of the first generation, which had already been pronounced dead, would have been much better investment choices than the much hyped Facebook IPO.


    130517 Facebook Compared to Other Tech Options
     via Statista.

    Had you invested $1,000 in Yahoo shares a year ago, you would have $1,787 today, instead of the $688 that Facebook’s early investors have left.

    Who knew?

    Related articles
    One Year Later, What We've Learned from Facebook's IPO
    See? A Year Later, No One Cares About Facebook's IPO Flop
    Morgan Stanley's happy Facebook anniversary
    Tableau Software's IPO Pops Big: Shares Skyrocket Up ~60% (DATA)
    Enhanced by Zemanta
  • Out with the Old … In with the New. This Is What Creative Destruction Looks Like.

    The chart below shows how an industry leader got replaced by an upstart.
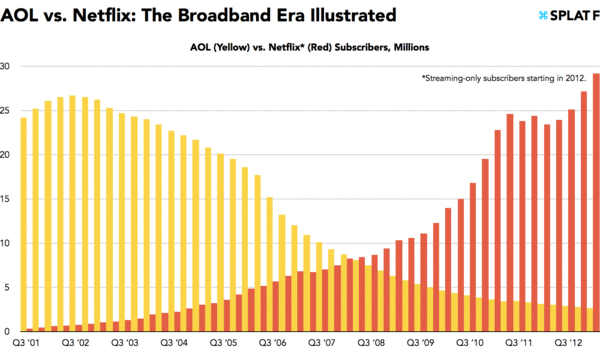
     130511 AOL v Netflix - The Broadband Era Illustrated

    No surprise here; you have seen it happen before.

    Given enough time, the victor of many battles is still likely to lose the war.  Positions of strength (which were won through hard work and much strategy) are often wiped away in what seems like an instant.

    Successful companies are not immune to competition
    or entropy.  As proof, the capitalist landscape is littered with the corpses of established
    products toppled by newer, cheaper products that (over time) got
    better and
    became a serious threat.

    What Causes An Established Leader to Falter?

    A closer inspection might suggest a deeper truth.  Perhaps this marketplace shift
    happens when the established player places too great an emphasis on
    satisfying their customers'
    current
    needs (for example, myopically focusing on what got them here, rather than
    'skating to where the puck will be …"). 

    In other words, companies
    are lulled into a false sense of security (by their progress, talent, infrastructure, etc.) and fail to adapt or adopt new technology that will
    meet customers' unstated or future needs.  Consequently, such
    companies eventually fall behind.

    The Chart Above Shows Only One of the 'Ripples'.

    The chart in this post shows AOL (which was the first mass entry point to the Internet and e-mail) and how 'Broadband' was captured by someone else (Netflix).  But it didn't just happen here.  What about Blockbuster? Don't you think their executives saw Netflix coming?  Still, somehow, a smart group of people chose to stick with their
    'bricks and mortar' business model … and lost billions in shareholder value.

    This creative destruction is a tectonic force in our marketplace. There have been books written on it (like Clayton Christiansen's the "Innovator's Dilemma"), and yet it's often surprising what happens.

    Huge Shifts Are Happening All Around You.

    When the Internet first gained popularity, who suspected a whole generation of Americans would 'cut-the-cord' and still be able to watch TV and movies on portable devices? Neither of my sons owns a TV. Many in that generation don't subscribe to cable at their house. Why?  Because they take for granted that they are able to stream the content they want to the device of their choice.

    That means someone is winning and someone is losing.

    The 'Old Way' Is Constantly Fading Away.

    Sometimes I buy fitness supplements from a small nutrition shop next to the gym I attend. It would be cheaper and easier to buy it online; but, I want to support a local merchant (and have someone to talk to if I have questions). But how long will that last?  I certainly don't buy computers at a computer store (or books at a book store).

    Likewise, when I first started trading, I talked to my broker often. It was comforting to know that I wasn't alone in the dark. But when was the last time you called a broker truly expecting a tradable insight or a real edge?

    Electronic trading is driving prices down, and I don't see how traditional financial service institutions can avoid the creative destruction of their old business models. I'm not just talking about how they interface with customers, even how they trade and manage risk has to change.

    That doesn't mean that a new business model won't arise. Of course it will. The point is just because something's been done a certain way for decades, doesn't imply it's right. In fact, it is a neon sign pointing to a strategic danger or opportunity (depending on your perspective).

    It is often by standing on the shoulders of the past that we are able to gaze into the future.

    A change is coming.

    Enhanced by Zemanta
  • Are the New Market Highs the Start of Something Bigger?

    The Markets are in rarefied territory.

    Have you been waiting around to "buy the dip" on this latest stock market rally?
    If so, you have been waiting a long time. 

    The Dow and the S&P 500 surpassed their all-time highs.

    How Strong is the Up-Trend?


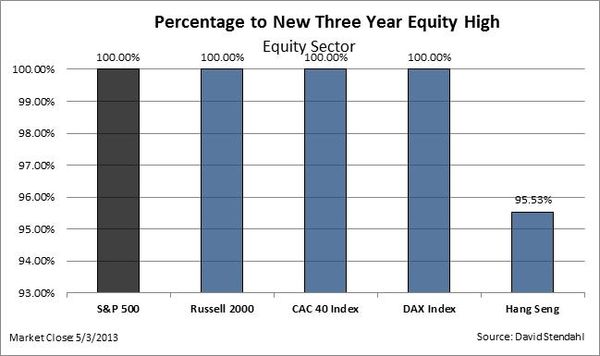
    The chart below compares equity markets to their three year highs. Thus, if a market is
    shown to be at 100%, then it's currently at a new three year equity
    high. If not, then the percentage number indicates how close it is to
    reaching a new equity high. 

    Looks pretty strong, globally; doesn't it?


    130505 Three Year Highs

    Also visit the Drawdowns Metric page to view historic equity high watermark charts.


    Does the economic, valuation, and political background support the budding euphoria? It just doesn't matter.  Traders know that when Markets go up on bad news … that is bullish.


    No Pull-Backs to Speak Of – That is Bullish Too.


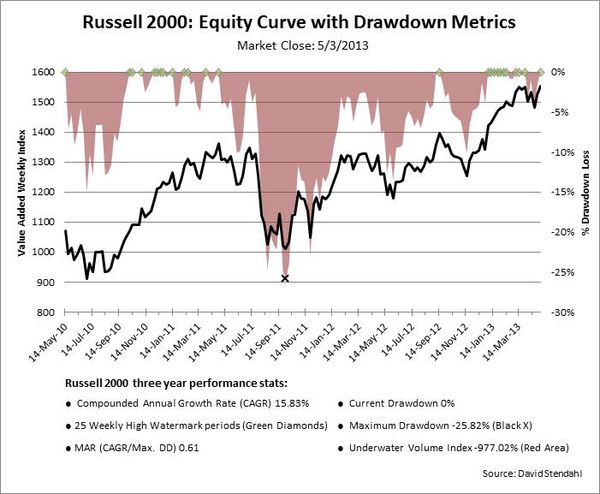
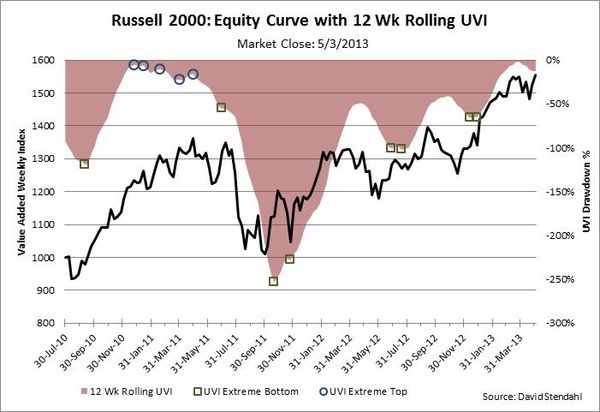
    Risk can be defined in many ways … the two Russell 2000 charts below focus on a variety of drawdown risk measures that provide prospective on past risk and potential opportunity.

    The Russell 2000, shown as a black line in each chart, is making new highs. In the chart below, the pink curve, shows the draw-downs from prior high water marks.  The green diamonds (at the zero line) show new highs.  This chart shows the past three years.

    130505 Russell 2000 Equity Curve with Drawdowns


    Drawdown Definitions

    • Current Drawdown: Open loss since last underwater equity high.
    • Maximum Drawdown: Largest peak-to-valley loss.
    • Underwater Volume Index: Accumulation of all drawdown periods.
    • MAR: A ratio that compares Reward, defined as Compounded Annual Growth Rate (CAGR)
      to  Risk, defined as Maximum Drawdown.


    To get a different perspective, the next chart smoothes the Under-Water Index (drawdown curve), by taking a twelve week moving average of it.  It is a good way to identify potential turning points for the Russell 2000.


    130505 Russell 2000 Equity Curve with Smoothed Drawdown Curve

    The Blue circles and Green squares signify possible tops and bottom for the market.

    One of the ways to use the rolling UVI chart is as a longer-term trend based indicator by watching the general direction of the UVI. If it's moving higher we might expect bullish systems to fare better, while if it's trending lower we might look for bearish systems to trade more effectively.

    Right now there is a negative divergence.  It is underwater while the market makes new highs.  This is where buying should come in … if not, then this is an early warning.

    To see this indicator on other markets, click here.

    The Trend is your friend … until it isn't.  But that is pretty easy to tell based on support and resistance levels and indicators like this.  Till then, enjoy it while you've got it.

    Enhanced by Zemanta
  • Here Are Some Links for Your Weekend Reading

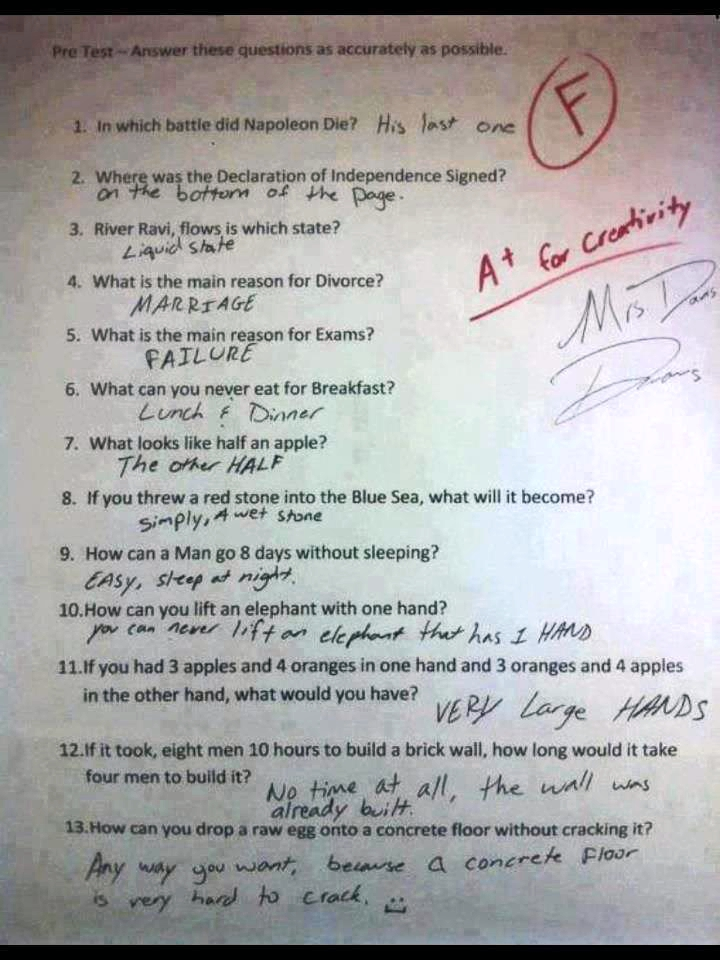
    Certainty is a 'funny' thing.  Just because you know the 'right' answer doesn't mean there isn't a different answer that might seem even more correct.


    130504 Test of Common Sense


    Here are some of the posts that caught my eye. Hope you find something interesting.


    Lighter Links:


    Trading Links:

  • Why the Fake-Tweet Market Reaction Was a ‘Good Thing’

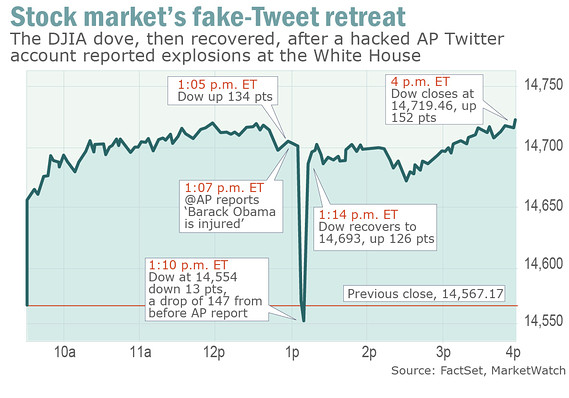
    You probably heard that a fake Tweet (claiming that something happened in Washington DC) caused the market to have a mini flash crash this past week.  Within minutes of that Tweet on Tuesday, more than $130 billion disappeared from the value of US stocks trading on Wall Street.


    130426 Fake Tweet Market Swoon
    Who is to blame … hackers, Twitter,  or perhaps algorithmic traders?  I don't think so.

    After looking at the data, here is a different perspective on what happened … and what I think it means for the future.

    Let's assume that a trading algorithm was able
    to identify a potential risk (or opportunity) and make a trade based on that information. Once that trade becomes visible to other traders through the open-market system, it's going to trigger a series of causes and effects.

    This is no different than when a local on the floor of an exchange places in order during slow market periods to clean out the stops. A spike down beneath people's risk tolerance creates a desire to sell. However, if there is no further selling pressure, the market will rise as traders suspect a 'bargain'. Does that constitute is a micro flash crash also?

    The point is that markets are becoming faster and more volatile. It doesn't make sense to complain every time something like this happens. It's going to happen with increasing frequency.

    This is now part of the market; consequently, it is time to figure out what to do with it. Some traders will move to faster and more responsive algorithms. Other traders will increase the time-frame that they focus on in order to filter out the "noise" and small variations like this constitute. 

    Whining about it and calling for increased regulation may be missing the point as well.  Why?  Because there is a financial incentive for algorithmic traders to become better at correcting these errors themselves. Frankly, it's too expensive to be wrong for long (especially when your trading large-size). As a result, the algorithms are going to get better at the 'two steps forward, one step back' testing and evaluation process. It's inevitable.

    Trading isn't about predicting the future. It's about calculating the probabilities better. By doing this you can know faster and act
    faster. This will likely result in smaller errors – and (if you care) the markets will seem more orderly. Nevertheless, what it really means is more ways to win for people who can spot the opportunities quick enough to take advantage of them.

    Enhanced by Zemanta