Trading

  • Interesting Charts About The S&P 500

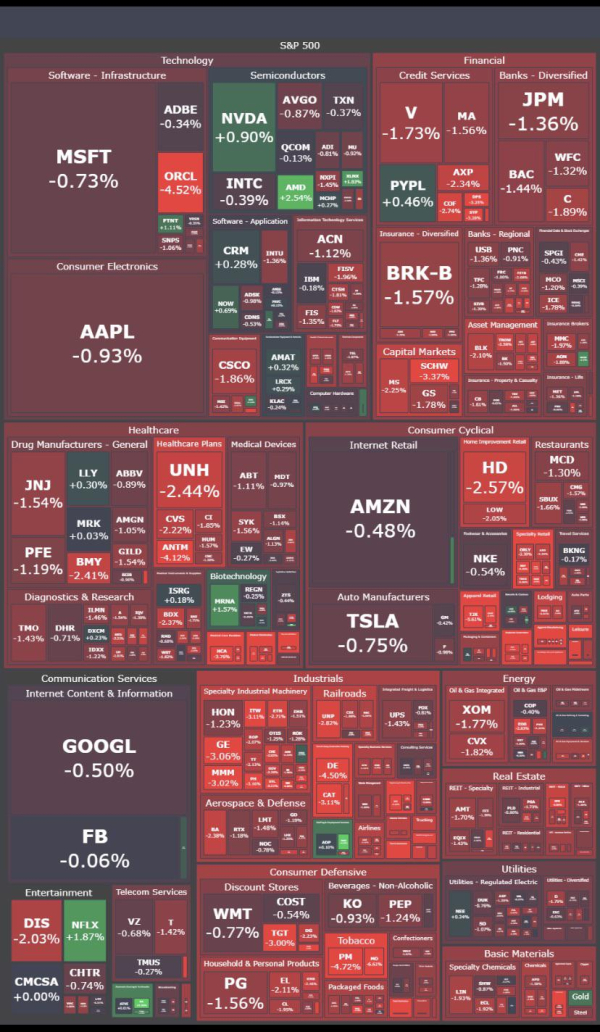
    The S&P 500 Index had another bad week and ended the month down 4.8%. It was the sharpest monthly decline since March 2020 – and finished a seven-month streak of gains.  Here is a heat map chart showing how widely spread the pullback was last week.


    T9xcilelaqq71

    via FinViz

    It will be interesting to see how the S&P 500 Index fairs in October as the Delta variant continues to linger, the Federal Reserve plans to slow its purchase of government-backed bonds, and fear continues around the U.S.'s cash reserves and debt limit.  Adding further pressure are the continuing shortages of many retail goods and computer chips. 

    But, for all the times we've expected a contraction, the market has shown remarkable resiliency in the past year and a half. 

    On a more lighthearted note, here are two charts I thought were interesting and worth sharing. 

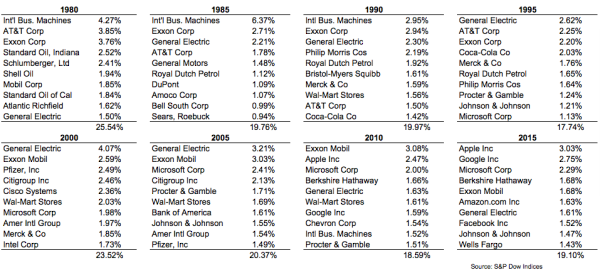
    First, here's a chart from A Wealth Of Common Sense that shows the top 10 stocks in the S&P 500 in 5-year increments. 


    Screen-Shot-2017-07-20-at-10.42.58-AMvia A Wealth Of Common Sense 

    There are a lot of interesting takeaways you can glean from this chart.  But I was surprised to see how much turnover there is. Also, in the 1980s, the top 10 companies were almost all energy companies, while today they're almost all tech companies. 

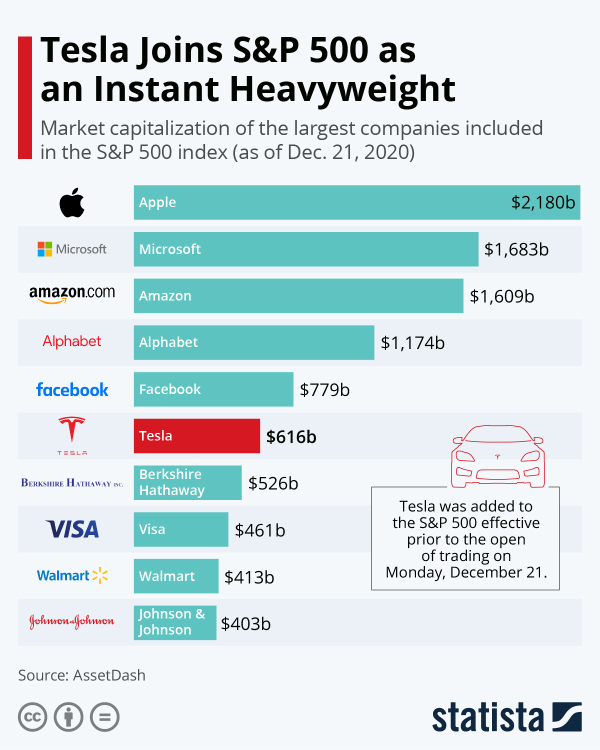
    Here's a bonus chart that shows the top 10 companies at the end of 2020. 


    23537via Statista 

    If you assume the market cap is approximately $32 Trillion, these ten companies account for around 30% of the market cap. That is a staggering amount. 

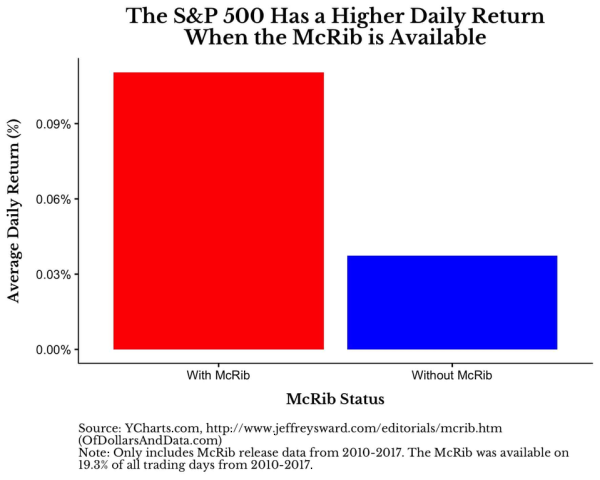
    For the last chart, here's a spurious correlation between the McRib being in season and the performance of the S&P.


    Cj6g3gjzbuq71via PuzzledHippo3
     

    With the McRib coming back on November 1st,  you might want to invest now. Seems like a solid bet. 

    Perhaps the correlation exists because McDonald's only offers the McRib when pork prices are low enough?  If so, McD's is reacting to the market (and not the other way around).

    There are many ways to make money in fast food (including food sales, real estate, and commodities trading).

  • The Data on Wealth Distribution in the US

    Talking about wealth distribution can lead to contentious discussions.

    The fact that one group has "more" of something literally means it is not equal to what someone else has … but does it imply that it isn't fair or just? The arguments get nuanced fast.

    Even how you look at the statistics can be confusing.  You can focus on which group has what percentage of the pie.  Or you could focus on which groups are gaining or losing based on the share they used to have of the pie.  With that said, remember that the pie can grow or shrink, and the percentage of a population in a demographic can change as well. What you choose to focus on, and what you decide it means, impacts your stance on the meritocracy or unfairness of what is happening (and what we should do about what is happening). 

    So, while many people point to the increasing wealth of the 1%, it's worth discussing whether this represents inequality or simply the asymmetric distribution of wealth. 


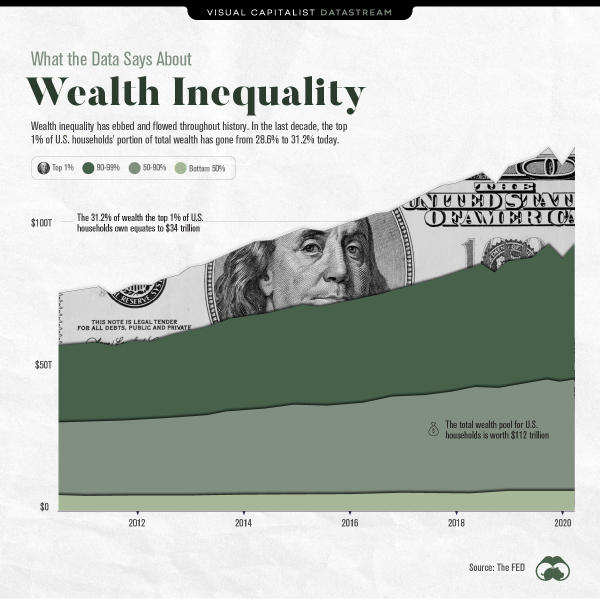
    Wealth-Inequality-Main

    via visualcapitalist

    Today, the top 1% of the U.S. owns about 31.2% of the total wealth. That's up from 28.6% in 2010. 

    However, the total wealth pool has increased from $60 trillion to $112 trillion in that same period. 

    In other words, each demographic has seen an increase in wealth over the past ten years. A larger percentage of the pie has gone to the 1%, but each demographic has benefitted and our collective economic pie has grown. 

    So, what drives the asymmetric distribution of wealth?

    There are multiple factors, but to name just a few: 

    • The longest bull market in history benefits the top 1% more because they own a much higher percentage of corporate equities and mutual funds
    • The minimum wage hasn't increased since 2009, despite rising costs of living and other goods.
    • Technological changes influence both more menial jobs as well as creating more opportunities for tech giants
    • Globalization plays a part both due to trade channels and due to the integration of numerous financial markets

    Are things better?  Are things good enough?  Do we have to do something? If so, what?

    Is this a red herring to distract us from other issues? 

    I'm curious to hear what you think about this issue.

  • Top Influencers (By Platform)

    When you ask children what they want to be, many likely say YouTuber, Influencer, or some other variant of that theme.

    Influence is a complicated thing. From an abstract perspective, it's the ability to affect someone else's behavior. A high schooler can influence their classmates. As entrepreneurs, we can influence our employees, our industry, and more. You can have immense influence over a small number of people or a little bit of influence over many people – both still count as "influence."

    But, in this case, many of the most popular influencers aren't famous for changing the world; they are celebrities or just famous for being famous.

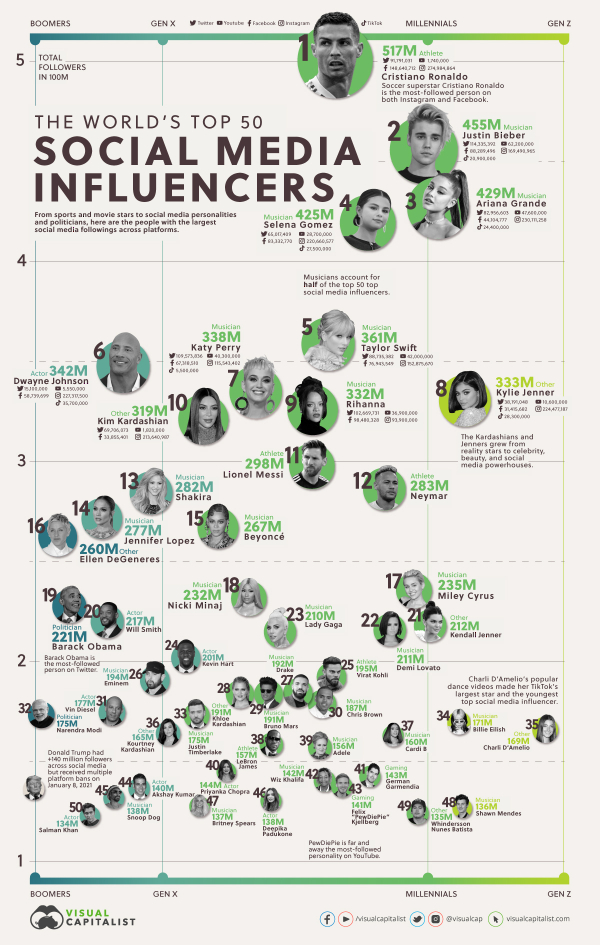
    Below is a chart of the top 50 "influencers" by social media platform. 


    Top-50-Social-Media-Influencers-2via visualcapitalist

    In the digital age, it's worth acknowledging social reach as power. People with a large platform have the opportunity to exert enormous influence – and it's why you often see the spread of misinformation reach far, fast. 

    It would be interesting to see how many of these people use their platforms to be a beacon to their followers (rather than a beacon to attract followers).

    It would also be interesting to see how much (or little) engagement many of these "influencers" actually have with their followers (and how that level of engagement relates to the growth or decay of their followings). 

    While I assume that the readers of this post aren't in the business of being "Influencers,"  Most of us recognize the value of influence – and getting more of it.

    As a result, it is probably worth thinking about influence as an asset.  And now is time to think strategically about how to grow and use that asset better. 

  • US vs. The World

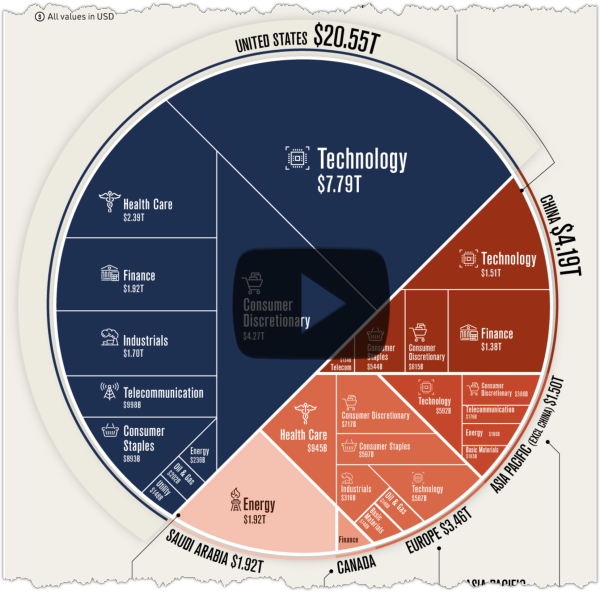
    Here is a chart that looks at the top 100 companies from the perspective of the U.S. vs the rest of the world. 

    Every year, PwC releases a list of the 100 biggest companies in the world by market cap. This year, Visual Capitalist put together a great visualization separating the companies into sector and country.

    Click To See the Full Image. 

    Screen Shot 2021-09-18 at 10.04.17 PMvia visualcapitalist

    The top 100 companies account for over $31.7 trillion in market cap. Unsurprisingly the U.S. takes the largest portion of the pie, but China continues to make headway. Though, the U.S. still accounts for 65% of the total market cap value of the top 100 companies. 

    A lot of the staying power of the U.S. (and the fading of much of Europe) can be attributed to Tech and Retail giants like Apple and Walmart. 

    I'll be interested to see how the numbers change as both Tech and Retail continue to grow as industries. Will other countries find a way to compete, or will the U.S. extend their lead?

  • Gartner’s 2021 Hype Cycle For Emerging Technologies

    Each year, I share an article about Gartner's Hype Cycle for Emerging Technologies. Here’s last year’s.

    It's one of the few reports that I make sure to track every year. It does a good job of explaining what technologies are reaching maturity, and which technologies are being supported by the cultural zeitgeist. 

    Technology has become cultural. It influences almost every aspect of everyday life.

    Identifying which technologies are making real waves (and will impact the world) can be a monumental task. Gartner's report is a great benchmark to compare reality against. 

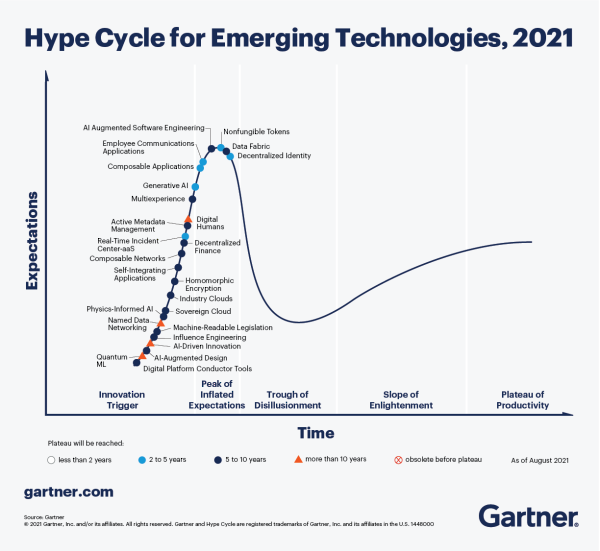
    2021’s trends aren’t all that different from 2020 – but you can now find NFTs, digital humans, and physics-informed AI on the list. While there have been a lot of innovations, the industry movers have stayed the same – advanced AI and analytics, post-classical computing and communication, and the increasing ubiquity of technology (sensors, augmentation, IoT, etc.). 

    What's a "Hype Cycle"?

    As technology advances, it is human nature to get excited about the possibilities and to get disappointed when those expectations aren't met. 

    At its core, the Hype Cycle tells us where in the product's timeline we are, and how long it will take the technology to hit maturity. It attempts to tell us which technologies will survive the hype and have the potential to become a part of our daily life. 

    Gartner's Hype Cycle Report is a considered analysis of market excitement, maturity, and the benefit of various technologies.  It aggregates data and distills more than 2,000 technologies into a succinct and contextually understandable snapshot of where various emerging technologies sit in their hype cycle.

    Here are the five regions of Gartner's Hype Cycle framework:

    1. Innovation Trigger (potential technology breakthrough kicks off),
    2. Peak of Inflated Expectations (Success stories through early publicity),
    3. Trough of Disillusionment (waning interest),
    4. Slope of Enlightenment (2nd & 3rd generation products appear), and
    5. Plateau of Productivity (Mainstream adoption starts). 

    Understanding this hype cycle framework enables you to ask important questions like "How will these technologies impact my business?" and "Which technologies can I trust to stay relevant in 5 years?"

    That being said – it's worth acknowledging that the hype cycle can't predict which technologies will survive the trough of disillusionment and which ones will fade into obscurity. 

    What's exciting this year?

    Before I focus on this year, it's important to remember that in 2019 Gartner shifted towards introducing new technologies at the expense of technologies that would normally persist through multiple iterations of the cycle. This change is indicative of more innovation and more technologies being introduced than in the genesis of this report. Many of the technologies from the past couple of years (like Augmented Intelligence, 5G, biochips, the decentralized web, etc.) are represented within newer modalities or distinctions. 

    It's also worth noting the impact of the pandemic on the prevalent technologies. 

    For comparison, here's my article from 2019, and here's my article from 2015. Click on the chart below to see a larger version of this year's Hype Cycle.
    Zz01ZmY4NGU1ZTAwZjgxMWVjYWI3MjY1MjhkNjNjMWEzNw==

    via Gartner

    Last year, the key technologies were bucketed into 5 major trends – but this year Gartner focused on 3 major themes.

    • Engineering Trust represents technologies that create the infrastructure of trusted businesses. The emphasis is on security, reliability, and repeatability of practices. Change is hard, and so is the integration of new technologies into existing businesses. That’s why it’s important to do it right the first time to prevent technologies from being cost centers.  Sample technologies from this year’s hype cycle include real-time incident command centers, data fabric, and sovereign cloud. If I could include a technology not on the list – I’d heavily support the blockchain as an instrumental asset in this domain.
    • Accelerating Growth is the second theme, and it builds on top of “Engineering Trust”. Once you have a good business core you can focus on driving organizational and industrial growth. Last year, "composite architectures" was a trend that emphasized the shift to agile/responsive architectures and decentralization. This year, many of the technologies gaining attention are AI-driven tools that can be applied to improve and accelerate human-facing support. Think HR training, customer service, and onboarding. As a culture, we’ve become more comfortable with the ubiquity of AI and technology, and while there are still ethical and societal roadblocks, you can expect many new use-cases to show up sooner rather than later. Sample technologies from this year’s hype cycle include digital humans, industry cloud, and quantum machine learning.  To see more of my thoughts on Accelerating Growth check out my article on “Turning Thoughts Into Things”.
    • Sculpting Change is the third theme and closes off what I believe is a very strong thematic year from Gartner. The nexus of this theme is that change is disruptive and that many of the technologies we will gravitate toward will be attempting to create order from the chaos. This is especially important in the context of rapid innovation, societal changes, and Covid-19. The emphasis of these technologies is on generalized and reliable technologies that are less brittle and specific than our current uses. AI is already a massively exciting space, but many of the use cases are too specific to be useful. Sample technologies include physics-informed AI, composable applications, and influence engineering.

    If we compare this year’s list to last year, I think we’ve seen a massive increase in the maturity of “Digital Me”, the integration of technology with people in both reality and virtual reality. But, we’ve seen less progress on “Beyond Silicon” despite the massive chip shortage. It’s a space I’m hoping to see more improvement in, fast, to meet increasing demand.

    Of course, I’m always most interested in the intersection of AI and other spaces. Last year, many of the emerging trends were AI-centric, and this year it feels as if AI has become the underpinning of broader trends. In my opinion, this points towards the increasing maturity and adoption of AI. Models are becoming more generalized, and able to attack more problems. They're becoming integrated with human behavior and even with humans.

    As we reach new echelons of AI, it's likely that you'll see over-hype and short-term failures. As you reach for new heights, you often miss a rung on the ladder… but it doesn't mean you stop climbing. More importantly, it doesn't mean failure or even a lack of progress.  Challenges and practical realities act as force functions that forge better, stronger, more resilient, and adaptable solutions that do what you wanted (or something better).  It just takes longer than you initially wanted or hoped.

    To paraphrase a quote I have up on the wall in my office from Rudiger Dornbusch … Things often take longer to happen than you think they will, and then they happen faster than you thought they could. 

    Many of these technologies have been hyped for years – but the hype cycle is different than the adoption cycle. We often overestimate a year and underestimate 10. 

    Which technologies do you think will survive the hype?
  • Remembering 9/11 – 20 Years Later

    On September 11, 2001, 19 extremist Al Qaeda militants hijacked four airliners and carried out suicide attacks against targets in the United States. Nearly 3000 people were killed during the attacks.

    Do you remember where you were when it happened?

    For most Americans, it’s easy. That moment – and its ripples – are imprinted on our minds. For my son, Zach, it was in his 3rd-grade class. They wheeled in a TV on a cart for the students to watch. One of his classmate’s uncles was killed in the attack.

    A colleague of mine was supposed to be in the tower that day but rescheduled a meeting for the following day – narrowly missing it.

    And now 20 years have passed. So much has changed. So much has stayed the same. We’ve analyzed the events of that morning a thousand ways from different vantage points … and it’s still impossible to fully grasp the weight of the event.

    It’s crazy to imagine that there are now full-fledged adults who have no memory of it.

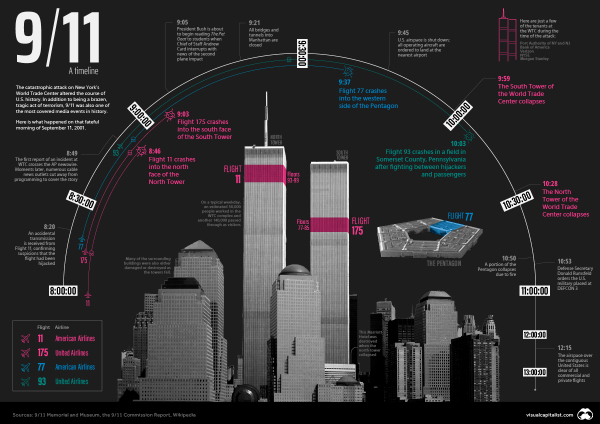
    And with that, Visual Capitalist put together a great chronology of the event.

    As we honor those that gave their lives – or had them taken from them – it’s a powerful reminder.

    Click the image to enlarge.

    911-terrorist-attack-timeline-preview-1

    via visualcapitalist

    The Pentagon has been repaired and we have a new World Trade Center in Lower Manhattan – but the wounds of that day still remain.

    Even more so for the actual first responders. With that, I’ll leave you with a powerful video from Jon Stewart, fighting for those first responders.


  • That’s B.S. … I mean Bishop Sycamore

    Last week, ESPN televised a blow-out of Ohio's Bishop Sycamore high school football program by Florida's IMG Academy. The score was 58-0.  But that has little to do with this story.

    Why do you care, and why am I writing about this? Because the story is crazy – and Bishop Sycamore is now under investigation for fraud.

    The supposed school in Colombus, Ohio, is not recognized by the state's athletic association … and the department of education doesn't list a school with that name. Despite that, they somehow scammed ESPN into scheduling the game.  

    Here are some of the troubling data-points. 

    • The head coach of the team, Roy Johnson, has an active warrant out for his arrest
    • They falsely claimed they had multiple Division 1 college prospects
    • Several of the players are junior college dropouts in their 20s and 30s
    • The school's address is a residence
    • ESPN couldn't verify any of the players in their scouting databases. 

    The director of Bishop Sycamore claims the school is not a scam, and his son is in the program.  On the other hand, the “school” currently doesn't even have a working website. 

    It's impressive that in this era of information access, a school could defraud the nation, not once, but twice

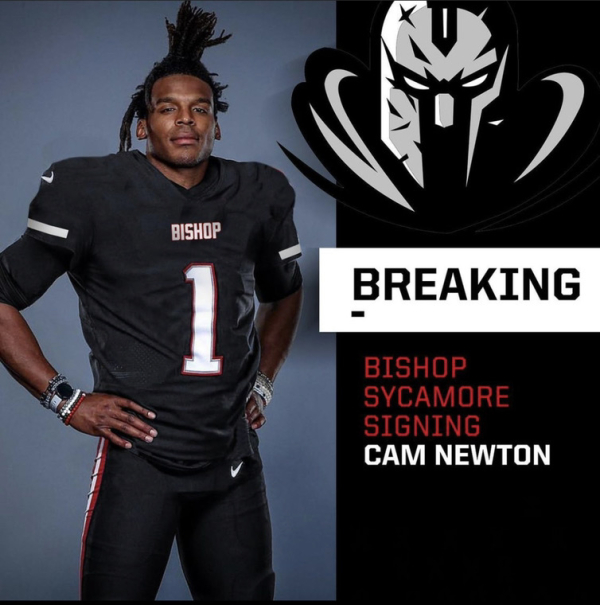
    I even heard that Cam Newton got picked up by Bishop Sycamore after getting dropped from the Patriots


    IMG_9529


    Not really … but this is an interesting story – and reflects how easy it is for “fake” things and get real coverage.

  • Confirmation Bias 101

    Echo chambers and confirmation bias aren't new.

    Recently, however, it seems that we are increasingly presented with issues divided into polar opposite points of view, with little to no tolerance for disagreement. 

    Nonetheless, not all topics need to be debated or negotiated. 

    Sometimes, a fact is a fact.

    Hopefully, this video won't step on any toes – but if you're a "flat earther," I wouldn't watch. 

    Here's a clip from Behind The Curve (a documentary on the flat earth society) that I think perfectly shows confirmation bias. 


    via Behind The Curve

    Start with the evidence and then form a conclusion. Doing that in reverse doesn't tend to work out as well.

    As a polite reminder, if a conspiracy relies on millions of people (as well as different countries and organizations) to all commit to the disinformation campaign … it's not likely true.

    As Occam's razor states, the simplest explanation is often the correct one. 

  • Thoughts on the ‘Hindenburg Omen’ and Market Instability.

    There are many interesting 'indicators' of market movements out there … from the Big Mac Index to the Super Bowl Indicator, and (of course) more common ones like rolling moving averages

    One of the more supposedly nefarious indicators is the Hindenburg Omen, and the pattern has shown up twice recently.


    Hindenburg_disaster

    What is it? 

    It is a fairly obscure technical analysis pattern, which supposedly gives an early warning of unstable market conditions (and even potentially stock market crashes).

    While the calculation is based on five factors, the primary conditions indicate a big disagreement about market conditions.

    For example, two of the conditions are that a substantial number of stocks have to be at yearly highs, while a substantial number of stocks have to be at new annual lows.  Ultimately, it is hard for those two conditions to be met in a short period of time unless there's uncertainty in the market.  Moreover, after a rally, uncertainty is often a precursor to a decline.

    In addition, technically (for the pattern to be complete), a second sighting of the five elements must occur within 36 days. Logically, lingering uncertainty is a momentum killer. 

    Should I Be Worried?

    This week, Cumberland Advisors' shared the following from Art Cashin, Director of Floor Operations for UBS Financial Services at the New York Stock Exchange. 

    Art had this to say: 

    “I had told Carl Quintanilla on CNBC’s Squawk on the Street in an interview about 10:20 that I thought the chatroom bears were turning a bit more aggressive. Several were trying to point out that we had had two Hindenburg Omens in a row. In case you had forgotten, a Hindenburg Omen is rather arcane indicator that takes as a measurement the ratio or relationship between the new 52-week highs and the new 52-week lows. It is quite unusual to have two days back-to-back with new Hindenburg Omens.

    Now, you have to be a little bit careful about the Hindenburg Omen because, over the last 35 or 40 years, we haven’t had a market ‘crash’ without the presence of the Hindenburg Omen, and that is what chatroom bears were pushing. You have to remember the other part of that, which is while there has always been a Hindenburg Omen before a crash, there has not been a crash after every Hindenburg Omen. To use a rather poor analogy, it is almost like saying, we have never had a flood without rain. But, then again, every time it rains, it doesn’t mean it is going to flood.

    So, it was, nevertheless, an effective tool among the chatroom types just to make people nervous. I am not sure how many have bought into the Hindenburg aspect, but it was one of those ‘Wait a minute – should I be aggressive on the buy-side or should I wait and hold back here?’ I think it had some of that effect.” – Art Cashin


    From my perspective, while this pattern may have correctly predicted every big stock market swoon of the past two decades (including the October 2008 decline), not every Hindenburg Omen has been followed by a crash. Resorting to a geometry analogy: All rectangles are squares, but not all squares are rectangles.

    Times are strange – and there's reason to be wary of the markets, but indicators like this are a reason to be cautious, not a basis for trading decisions. 

  • Camp Kotok 2021

    Each year I look forward to Camp Kotok, or as I like to call it Economists in Nature. It's basically 5 days of canoeing, fishing, and dining with economists, wealth managers, traders, investors and more. 

    One of few chances for people from these backgrounds to come together and talk about the world, big trends, investing, economics, politics, and more … in an open and safe forum. The event goes by the Chatham House Rule – which basically means you can share the information you receive, but not who said it. 

    E8xevicXMAEJCVR

    This year we talked about everything from China, digital currencies, the pandemic, and the state of markets. 

    Interestingly, for all the takeaways I could focus on, the main takeaway was uncertainty. 

    For all the intelligent and "in-the-know" people in the room, very few people had clear opinions of what was going to happen. There were too many variables at play, and while they posited a lot of potential paths, it feels like the general census was we're at a crossroads with many potential futures in front of us. 

    Despite the general uncertainty in the room, it wasn't fear-laden. The general mood was optimistic, and for the most part, everyone sees paths toward economic success post-COVID.

    With that said, when and what "post-COVID" means is another issue.

    One of the other key discussions that came up often was the new generation of workers and their changing relationship with work. It's plain to see the rate of quitting is higher, that wages are rising, and it's getting hard to fill minimum wage jobs. It's hard to get employees back in an office space, and many are willing to take pay cuts or switch to other companies to stay at home. 

    The long-term impact on our economy (and our culture) is yet to be seen.

    We live in interesting times. 

    As a bonus, here's an interview I shot at Camp Kotok in 2018 with Bob Eisenbeis,  Cumberland Advisors' Vice Chairman & Chief Monetary Economist.  Check it out.  


    Cumberland Advisors via YouTube