Obama's China Visit.
President Obama asked for patience about the economy. Nonetheless, a Gallup poll showed his job approval rating had dropped to 49 percent, the first time he has fallen below 50 percent in this survey, as Americans express dissatisfaction with his handling of the economy and other issues.
Unfortunately for him (and us) that wasn't the only voice of dissatisfaction he's heard lately.

Also, here is a skit from Saturday Night Live. Like most good humor, it is funny because of how much is true. I'm not posting it for partisan reasons … rather, it made me laugh. Hope you enjoy it too.
Market Commentary: Spotting an Island Reveal Pattern.
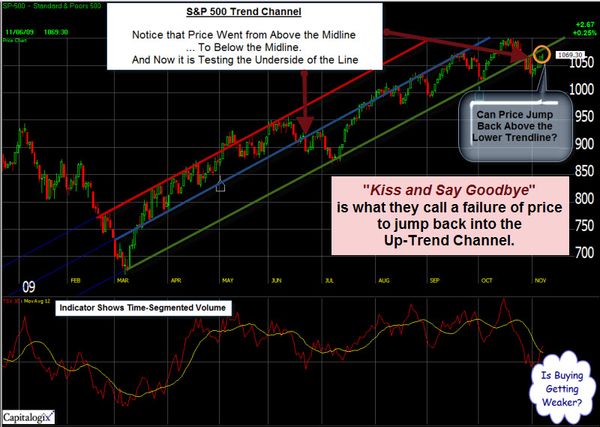
In general, the markets held-up again this week. As I scan the charts, there is little new or opinion-changing information. However, I spotted an Island Reversal pattern on an intra-day chart of the S&P 500. This is often seen at market tops. It starts with a break-away gap (shown by the green circle) and ends with an exhaustion gap (shown by the red circle and the big red arrow).

To understand this pattern, you can think of it as the last buyers rushing to get in (pushing-up price so fast that it creates a break-away gap), only to find that there are no new buyers (causing a price drop and the resulting exhaustion gap). This gap down can signal the beginning of a change in trend.
In this particular case, we are coming into a holiday-shortened week (often characterized by light trading). So I'm not expecting anything dramatic. Still, it seems worth watching to see if the market trades back up above the exhaustion gap.
Something Changed: Small Caps and Techs are Not Leading The Way.
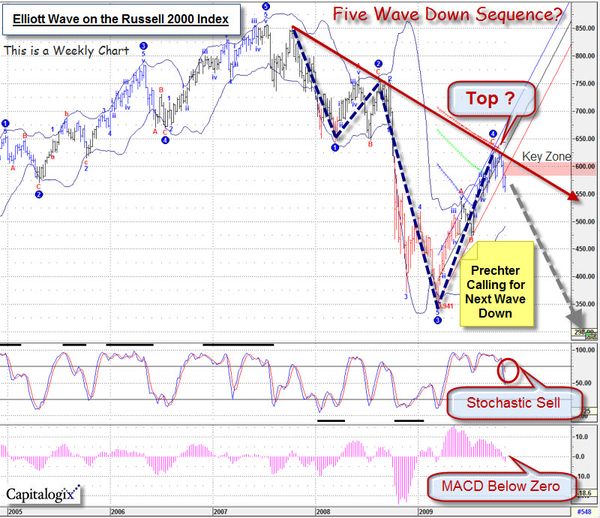
Here is something else that caught my eye. The chart below shows that the Russell 2000 Index (shown in green below) has led the way throughout the recent rally. The S&P 500 Index (shown in red below), represents the broader market. While the Dow Jones Industrial Average (shown in blue below) lagged. You can click the chart image below to launch an interactive version on Stockcharts.com. This chart shows the relative performance of these indices during the past year. You can adjust the date range by dragging the date bar at the bottom.

The next chart shows the same information, except limited to the past month. Notice that the relative performance of these indices has reversed.

I'm watching this rotation to see if small caps recover or continue to show weakness. They could be the canary in the coal-mine for a bigger correction.
Business Posts Moving the Markets that I Found Interesting This Week:
- Fed Eyes Dollar Drop, But Clings to Low-Rate Pledge. (FluentNews)
- Goldman Outlines Fed’s New Dashboard Indicators. (WSJ)
- Buffett Says His Businesses Have Bottomed (Reuters)
- Memo to Buffett: Put Down the Pom-Poms & Tell Us the Truth. (HuffingtonPost)
- New Market Bubble is Brewing: It's Déja Vu All Over Again. (Newsweek)
- While U.S. Economy Struggles, China's Rises. (NPR)
- More Posts Moving the Markets.
Lighter Ideas and Fun Links that I Found Interesting This Week
- Is Too Much Science Thwarting American Innovation? (FastCompany)
- 15 Google Interview Questions. Answers at the End. (BusinessInsider)
- How Ritz-Carlton Stays At The Top. Interesting. (Forbes)
- Twitter: People Tweet 27 Million Times a Day. (HuffingtonPost)
- Let Them Eat Dog. (WSJ)
- Forbes Blog Post on How Leaders Balance Urgency & Patience. (Forbes)
- More Posts with Lighter Ideas and Fun Links.