Market Commentary

  • Capitalogix Commentary 10/18/09

    Dow 10,000 – Version 2.0.

    SNL made a joke that hitting Dow 10K was different this time.  The difference was that 15 million unemployed Americans cheered while they watched CNBC on their couch in their pajamas.

     091019 Letting the Air Out of Hope

    The U.S. Equity Indices continue to perform well.  The economy, however, is sending mixed signals.  At this point, some would argue that any positive economic signal is a welcome signal.

    Mixed Signals: Two Charts Giving Us Different Views Into a Potential Economic Recovery.

    The first chart shows that unemployment is still growing faster than new job growth.  Recent readings show six unemployed people for each potential job opening.  A glance at the chart shows that ratio is usually 2:1 (rather than 6:1).  I'll be watching this indicator, and will take even a small improvement as a positive sign for the economy.

     091019 Number of Unemployed Per Job Opening

    Speaking of positive signs of economic recovery, the next chart does show a hopeful turn of events (based on increasing Capacity Utilization).

     091019 Capacity Utilization Up-Turn

    Utilization has increased for three straight months, and is up from the record low set in June (the series starts in 1967). Capacity Utilization had decreased in 17 of the previous 18 months.  An increase in capacity utilization is usually an indicator that a recession is over.  Let's hope it keeps up.

    When In An Up-Trend, Like This, Don't Fight the Fed.

    I was reading "A Dash of Insight" and saw this investment hypothesis: "The government is on a mission.  You may not like the policies, but as an investor, you fight it at your peril."  In other words, don't fight the Fed.

    Recently,
    that has been a painful lesson to Bears trying to short the rally.  The
    result, a dramatically declining short interest.  Here is a chart from
    Bespoke, illustrating that point.

     091019 Short Interest Declining

    At a certain point, the lack of sellers
    becomes the contrarian indicator that we are near a top.  Again, in
    trending markets, too much thinking is dangerous.  Just consider this
    another indicator to watch when the up-trend finally breaks.

    Business Posts Moving the Markets that I Found Interesting This Week:

    • Impacts of High-Frequency Trading – Manipulation, Distortion or Improvement? (Wharton)
    • Blue Chips Top 10,000 for the First Time in a Year. (WSJ)
    • Loose Monetary Policy: When Will Wall Street's Biggest Gravy Train Slow? (WSJ)
    • Goldman Sachs Sees a "Perfect Storm" for M&A. (StreetInsider)
    • Venture Capital Exits Dallas and Other Places Outside of Silicon Valley. (WSJ)
    • Pessimistic Commentators Remain Anything But Convinced by the Rally. (Economist)
    • Bloomberg Buys BusinessWeek From McGraw-Hill. (StreetInsider)
    • More Posts Moving the Markets.

    Lighter Ideas and Fun Links that I Found Interesting This Week

    • Mossberg Gives Windows 7 a Good Review. (WSJ)
    • White House Tells Fox Network News to Take a Hike. (Newser)
    • Patent Auctions Offer Protections to Inventors. (NYTimes)
    • Facebook Has a Happiness Index Drawn From Posts. (NYTimes)
    • Anthropologist: Modern Male Is 'Worst' Man Ever. (Newser)
    • Un-Tapped Potential: Autistic Savant Draws Cities from Memory. (Wiltshire)
    • Cool Chart of Apple's Path To 2 Billion iPhone App Downloads. (BusinessInsider)
    • More Posts with Lighter Ideas and Fun Links.
  • Capitalogix Commentary 10/11/09

    This was a good week for bullish traders.  Sure volume was light for the rally.  But selling was even lighter.  In a trending market, thinking too much can be detrimental to your wallet.  And from March until now, the trend points up.

    What Does the Bigger Picture Show?

    A weekly chart of the SPY, which is the ETF for the S&P 500, shows price coming into a cluster of resistance.  There are three things that jump out at me.  First, we are at the 50% Retracement of the October 2007 to March 2009 downswing.  Second, price is also are trying to break through the long-term downtrend line from that bear swing.  And third, there is a significant Gap (which often acts as resistance) at that same level from last October.

    091011 SP500 Decision Cluster

    The good news is a move above this level would be quite bullish.

    Can We Move Higher?

    The market does not directly reflect the economy.  So price can go
    higher, even without a real economic recovery.  For traders, the
    question is how long the rally will be sustainable?  The answer is
    simple; it is sustainable until price breaks the trendline. 

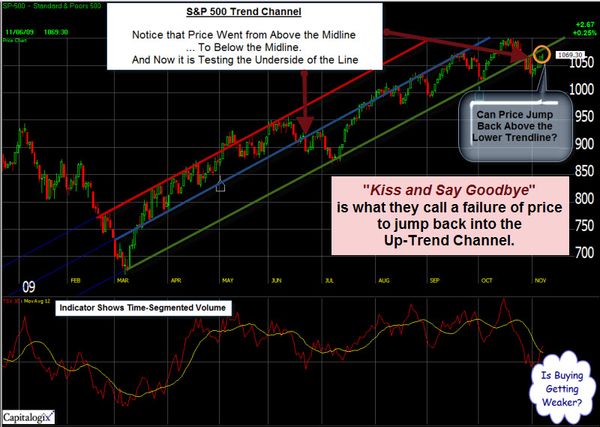
    It is a little tricky, here, because we have the battle of two trendlines. 

    What About the Economy?

    As for the economy, consumer spending has been weak, so expect that corporate revenues will continue to drag. And companies straining to realize their inflated expectations for 2010-11 earnings will continue to focus on cutting costs, which translates into cutting jobs.  Unfortunately this likely results in even less consumer spending …

    Where Are Consumers Spending?

    This chart from the New York Times tells an important story.  It shows where consumers are spending … and where they aren't.  Last year, consumers pulled back on spending and the retail sector suffered. But not all retailers are faring worse than they did a few years ago. 

    Against a baseline of spending levels in 2003, sales in computer stores have continued to rise. Restaurant and liquor-store sales are at much higher levels, and purchases at warehouse stores are up nearly 50 percent.

    Still, in major retail divisions like home furnishings and clothing, sales faltered in 2007 and are now below their levels of 2003.

    091011 Where Shoppers Spend

    Does a Weak Dollar Matter?

    This chart series from Bespoke highlights one reason that a weak dollar matters.  While gold is at record highs in dollar terms, the commodity is still down 10% from its highs when priced in Euros or Yen.  This indicates that the strength is a function of a weaker dollar rather than a real increase from demand.

    091011 Gold ValueThe same logic applies to the recent market rally.  If the dollar gets stronger, expect the market to move down.  Consequently, many traders are watching the dollar as it tries to bottom.

    Business Posts Moving the Markets that I Found Interesting This Week:

    • What's Luck Got to Do With It? The Math of Gambling. (NewScientist)
    • Women, Testosterone & Finance – Risky Business? (Economist)
    • Private Equity's Return Dilemma – Hope Dwindling for a New Buyout Boom.(WSJ)
    • Please Do Feed the Bears – The Financial World Needs Its Pessimists. (Economist)
    • Return of Day Traders Drives Volume; But Who Is Sitting-Out? (WSJ)
    • Uncommonly Clever Economic Indicators. (Forbes)
    • More Posts Moving the Markets.

    Lighter Ideas and Fun Links that I Found Interesting This Week

    • Microsoft Offers Free Security Essentials Anti-malware Package. (InformationWeek)
    • More Cases of Autism in U.S. Kids Than Previously Realized. (CNN)
    • A Credible Kindle Killer? Competitors Team-up to Take on Amazon. (Forbes)
    • Tracing the Origins of Human Empathy. (WSJ)
    • Allocate Hours for Maximum Productivity in Your Perfect Day. (ETR)
    • Samurai Mind Training for Modern American Warriors. (Time)
    • More Posts with Lighter Ideas and Fun Links.

  • Capitalogix Commentary 10/04/09

    The Trend Is Up; So Discipline Says Buy the Dip.

    Most of the U.S. Equity Indices (Dow, S&P 500, Russell 2000 and the MidCap Index) have pulled-back to their 50-Day moving averages and short-term support.  So have many sectors, including: Financials, Metals, Energy, Drugs, Materials, and Consumer Discretionary.  This would be a likely place for bulls, looking for a continued rally, to put some extra cash to work in the markets by buying the dip.

     091004 Buying the Dip on the Dow

    Tech is still leading the rally.  So I'm watching that area closely for continued strength.  A lack of buying here is a warning sign.

    The Market Is Getting Jiggy.

    One thing tempering my confidence in the "buy the dip" strategy is that I noticed a lot more "mischief-bars" recently.  These head-fake moves show-up on charts as jaggy spikes, and often shake-out weak holders … only to reverse sharply.  Here is a chart of the S&P 500 from Tim Knight's Slope of Hope site.  The yellow sections highlight areas where it is easy to see the spikes in volatility. 

     091003 SP500 Starting to Show Volatility Spikes

    This type of behavior often happens near major trend changes, and reflects the disagreement between bulls and bears.

    Does the Recent Weekly Buying Climax Signal Exhaustion?

    For those looking for further evidence of a turning point, Investors Intelligence recently released a chart showing major buy and sell climaxes in the S&P 500.  As you can see, they often come at major turning points for the markets.  The Blue Bars show Weekly Buying Climaxes, which occur when a stock makes a 52-week high and
    then closes lower for the week. This represents distribution from strong
    hands to weak ones and most often occur around market highs.  And the Red Bars mark Weekly Selling Climaxes, which occur when a stock makes a 52-week low and
    then closes higher for the week. This represents distribution from weak
    hands to strong ones and most often occur around market lows. 

     091003 Buying Climax Could Signal Trend Change

    This chart shows that there were 380 total Weekly Buying Climaxes as of the end of last week (see the blue bar at the bottom right of the chart). This was the highest buying total since June 2007 (which is the blue bar circled in red, towards the bottom left of the chart) and eclipses the extreme reached at the October 2007 top. Investors Intelligence notes, that after four months, climax signals for those who sell into buying climaxes and buy into selling climaxes are correct about 80 percent of the time. So another indicator has flashed a “warning” that suggests we be especially attentive to a trend change.

    Employment Numbers.

    Of course the other thing weighing down the hopes of economic recovery is unemployment.  The numbers haven't been improving.  Moreover, I expect to start hearing about the next wave of big cuts (that cut muscle, and not just corporate fat). Recent quarterly results showing corporate profits were often based on cost-cutting, which may not be sustainable. Revenue is a more telling indicator.

     Sat_Edit_Darkow_090509_t938

    This is something that bears watching.  The next topic bears watching too.

    All You Need to Know About High Frequency Trading.

    Here is a short video from the Jon Stewart Show.  It portrays High-Frequency Trading in a less than flattering light. It was funny; yet made some non-trivial points.

    The Daily Show With Jon Stewart Mon – Thurs 11p / 10c
    Cash Cow – High-Frequency Trading
    www.thedailyshow.com
    Daily Show
    Full Episodes
    Political Humor Ron Paul Interview

    Ultimately I believe that innovation and intelligence can lead to competitive advantage. And, generally, that is a good thing. However, even a good thing can be taken too far. This is an area that needs some common-sense legislation and oversight. High Frequency Trading makes it too easy to manipulate price and markets.

    Business Posts Moving the Markets that I Found Interesting This Week:

    • S&P Says Stock Buybacks At Lowest Level On Record. (StreetInsider)
    • Is Wall Street Taking a Chance on Risk, Again. (DealBook)
    • Fretful Investors Sidelined by Rally. (WSJ)
    • Kass – Pokes Some Fun at the "Dumb Money" Behind the Rally. (TheStreet)
    • More Than Half of Residential Mortgages Made by Just 3 Large Banks. (WSJ)
    • If Lehman Hadn't Failed, Would the Crisis Have Happened Anyway? (Economist)
    • More Posts Moving the Markets.

    Lighter Ideas and Fun Links that I Found Interesting This Week

    • Did Kindle edition of Dan Brown's 'Lost Symbol' Out-Sell Hardcover Editions? (WSJ)
    • The "Lost Symbol" Shines Spotlight on Freemasons in Washington. (USNews)
    • Leading Research Universities Launch Futurity Online Research Portal. (Duke)
    • Simplifying Supplements: Modern Diet is Energy Rich, Yet Nutrient Poor. (Ode)
    • Four Things that May Sabotage Your Weight-Loss (USNews)
    • Business Intelligence Gives Way to Operational Intelligence. (Forbes)
    • More Posts with Lighter Ideas and Fun Links.

  • Capitalogix Commentary 10/04/09

    The Trend Is Up; So Discipline Says Buy the Dip.

    Most of the U.S. Equity Indices (Dow, S&P 500, Russell 2000 and the MidCap Index) have pulled-back to their 50-Day moving averages and short-term support.  So have many sectors, including: Financials, Metals, Energy, Drugs, Materials, and Consumer Discretionary.  This would be a likely place for bulls, looking for a continued rally, to put some extra cash to work in the markets by buying the dip.

     091004 Buying the Dip on the Dow

    Tech is still leading the rally.  So I'm watching that area closely for continued strength.  A lack of buying here is a warning sign.

    The Market Is Getting Jiggy.

    One thing tempering my confidence in the "buy the dip" strategy is that I noticed a lot more "mischief-bars" recently.  These head-fake moves show-up on charts as jaggy spikes, and often shake-out weak holders … only to reverse sharply.  Here is a chart of the S&P 500 from Tim Knight's Slope of Hope site.  The yellow sections highlight areas where it is easy to see the spikes in volatility. 

     091003 SP500 Starting to Show Volatility Spikes

    This type of behavior often happens near major trend changes, and reflects the disagreement between bulls and bears.

    Does the Recent Weekly Buying Climax Signal Exhaustion?

    For those looking for further evidence of a turning point, Investors Intelligence recently released a chart showing major buy and sell climaxes in the S&P 500.  As you can see, they often come at major turning points for the markets.  The Blue Bars show Weekly Buying Climaxes, which occur when a stock makes a 52-week high and
    then closes lower for the week. This represents distribution from strong
    hands to weak ones and most often occur around market highs.  And the Red Bars mark Weekly Selling Climaxes, which occur when a stock makes a 52-week low and
    then closes higher for the week. This represents distribution from weak
    hands to strong ones and most often occur around market lows. 

     091003 Buying Climax Could Signal Trend Change

    This chart shows that there were 380 total Weekly Buying Climaxes as of the end of last week (see the blue bar at the bottom right of the chart). This was the highest buying total since June 2007 (which is the blue bar circled in red, towards the bottom left of the chart) and eclipses the extreme reached at the October 2007 top. Investors Intelligence notes, that after four months, climax signals for those who sell into buying climaxes and buy into selling climaxes are correct about 80 percent of the time. So another indicator has flashed a “warning” that suggests we be especially attentive to a trend change.

    Employment Numbers.

    Of course the other thing weighing down the hopes of economic recovery is unemployment.  The numbers haven't been improving.  Moreover, I expect to start hearing about the next wave of big cuts (that cut muscle, and not just corporate fat). Recent quarterly results showing corporate profits were often based on cost-cutting, which may not be sustainable. Revenue is a more telling indicator.

     Sat_Edit_Darkow_090509_t938

    This is something that bears watching.  The next topic bears watching too.

    All You Need to Know About High Frequency Trading.

    Here is a short video from the Jon Stewart Show.  It portrays High-Frequency Trading in a less than flattering light. It was funny; yet made some non-trivial points.

    The Daily Show With Jon Stewart Mon – Thurs 11p / 10c
    Cash Cow – High-Frequency Trading
    www.thedailyshow.com
    Daily Show
    Full Episodes
    Political Humor Ron Paul Interview

    Ultimately I believe that innovation and intelligence can lead to competitive advantage. And, generally, that is a good thing. However, even a good thing can be taken too far. This is an area that needs some common-sense legislation and oversight. High Frequency Trading makes it too easy to manipulate price and markets.

    Business Posts Moving the Markets that I Found Interesting This Week:

    • S&P Says Stock Buybacks At Lowest Level On Record. (StreetInsider)
    • Is Wall Street Taking a Chance on Risk, Again. (DealBook)
    • Fretful Investors Sidelined by Rally. (WSJ)
    • Kass – Pokes Some Fun at the "Dumb Money" Behind the Rally. (TheStreet)
    • More Than Half of Residential Mortgages Made by Just 3 Large Banks. (WSJ)
    • If Lehman Hadn't Failed, Would the Crisis Have Happened Anyway? (Economist)
    • More Posts Moving the Markets.

    Lighter Ideas and Fun Links that I Found Interesting This Week

    • Did Kindle edition of Dan Brown's 'Lost Symbol' Out-Sell Hardcover Editions? (WSJ)
    • The "Lost Symbol" Shines Spotlight on Freemasons in Washington. (USNews)
    • Leading Research Universities Launch Futurity Online Research Portal. (Duke)
    • Simplifying Supplements: Modern Diet is Energy Rich, Yet Nutrient Poor. (Ode)
    • Four Things that May Sabotage Your Weight-Loss (USNews)
    • Business Intelligence Gives Way to Operational Intelligence. (Forbes)
    • More Posts with Lighter Ideas and Fun Links.

  • Capitalogix Commentary 09/27/09

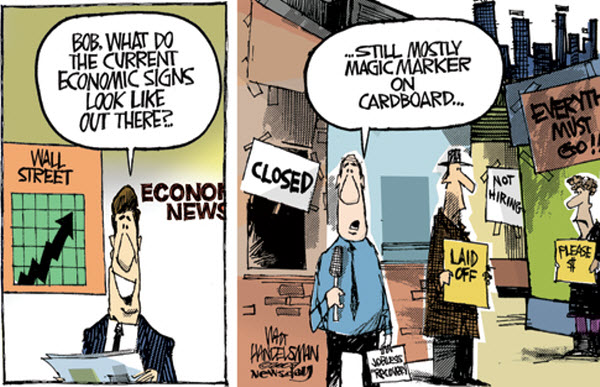
    Bernanke said that the recession is "most likely over"; but added that the recovery would be jobless.

    Recession Likely Over Cartoon

    Moreover, recent surveys show that many companies expect to shed jobs
    in the next 12 months and do not expect to reach former staffing levels
    before 2012. The question is: How will that affect the economy and the markets?

    Are They Buying or Selling the News?

    I'm paying attention to indications that the markets have begun selling-off after news.  This is typical behavior near tops and during bearish swings.  In contrast, during the recent rally, the Markets often went up despite bad news.

    There Still Is Not Much Selling Pressure.

    From a technical and market psychology perspective, we are seeing short spikes of intra-day selling that have not had much follow-through.  However, it seems to me that fewer people are buying the dips and a bunch of negative divergences are in place.  All that means is that it is time to watch major trend lines; they will tell you when something changes. 

    Is Something Fishy Churning Just Beneath the Surface of Our Markets?

    Several articles claim that up to 40% of the volume in the New York Stock Exchange, recently, occurred in just four financial stocks: Bank of America, Citigroup, Fannie Mae, and Freddie Mac

    It could be normal, or at least something simple and innocent. Nonetheless, I am suspicious and a little skeptical that such a small group of low-priced stocks could account for such an unusual percent of the trading volume on the NYSE. Realistically, I doubt that it was retail investors jumping-in to drive the rally higher.

    So was it churning, high-frequency flash trading, or a tacit government
    sanctioned way to allow certain funds and brokers to profit while
    making the markets appear healthier than they are?  I don't know; but it has started people talking.  And it is something that will stay on my radar.

    The Changing Face of the Giants of Finance.

    On a related topic, the NYTimes had a great interactive graphic showing how the Giants of Finance have changed.  Since the stock market’s peak in October 2007, Wall Street’s landscape has been permanently altered. Lehman Brothers, gone. Bear Stearns, gone. Merrill Lynch, gone. Main Street’s landscape has also changed. Wachovia, National City, Washington Mutual and Countrywide, all gone. These financial giants all crumbled under the weight of the financial crisis.

    Those that were left shrank down to a fraction of their former market capitalizations by early 2009, but since then, they all have grown. While most are nowhere near their former size, two — JPMorgan Chase and Wells Fargo — are slightly larger than they were at the market’s peak.  Click the image to play.

    090927 Giants of Finance

    Let me know what you think. Hope you have a great week.

    Business Posts Moving the Markets that I Found Interesting This Week:

    • Retail Hopes Running Ahead of Reality. (WSJ)
    • As Biggest Banks Repay Bailout Money, the U.S. Sees a Profit. (NYTimes)
    • Foreign-Account Holders May Face Double Trouble Treasury & IRS.(InvestNews)
    • Wall Street’s Math Wizards Forgot a Few Variables. (NYTimes)
    • Econophysicist Predicts Date of Chinese Stock Market Collapse. (TechReview)
    • More Posts Moving the Markets.

    Lighter Ideas and Fun Links that I Found Interesting This Week

  • Capitalogix Commentary 09/20/09

    Another week of strong performance by the markets leaves me searching for clues and signs of weakness. It's not that I don't like how the markets are reacting; because this has been a nice traders market. However, trading is about risk management and doing your best to recognize fear or greed.

    So, one of the indicators I use to probe beneath the surface of the market is a measure of what the largest traders, Mutual Funds, are doing. There is a phrase that explains this well. Elephants leave tracks.

    090920 Mutual Fund Selling

    As you can see, while the markets continue to make new highs, Long-term mutual fund investors have reversed this month; selling shares, rather than dumping money in. Based on the first two weeks of the month, September's outflows will be bigger than the inflows seen in the last three months combined.

    It's not surprising that commercial traders are far less bullish than retail investors at this point of the rally.  This Dilbert cartoon sums up the way traders have been playing: "Forage during daylight and Hide at Night."

    090920 Dilbert Forage By Day and Hide at Night

    More telling, perhaps, is that company insiders have been doing their best to sell recently. For example, in August, each dollar of insider buying was dramatically overshadowed by $30 of insider selling.  Here is a chart from Insidercow showing how bearish insiders are right now.

    090920 Insiders Selling Not Buying

    Another indicator of indecision shown by the Japanese candlestick pattern called a Doji. It forms when the market opens and closes at approximately the same price, despite having gone higher and lower throughout the day. It indicates a fundamental disagreement between buyers and sellers, and as you can see by the chart below, often marks a reversal point.  In the daily chart of the NASDAQ, below, I marked Doji reversals.

    090920 NasdaqDoji

    None of this means that the market is going to make new lows. Instead, they're just clues. In my experience though, it's better to prepare for a storm before it hits. If it passes without incident, the planning and preparation are probably still worthwhile.

    If remember the every trade is the result of a disagreement, someone is betting that the price will go up, while someone else is betting that prices going down. Being able to see a trade from both perspectives is a good skill to develop. If you're bullish right now, use the opportunity to understand what a short seller might be seeing at this point in time. And if you're convinced the market is going down, then remember the adage don't fight the Fed and how important sentiment is. Look for areas of breakout to the upside.

    Business Posts Moving the Markets that I Found Interesting This Week:

    Lighter Ideas and Fun Links that I Found Interesting This Week

  • Capitalogix Commentary 09/13/09

    Let's Get Ready to Rumble.

    Football season came just in time. The economy, health-care, and wars were starting to harsh my mellow.

    Watching football is like a national meditation technique; it helps
    quiet the noise and is a great distraction from the daily grind.

    Football Season

    The Markets seem to be doing a good job of avoiding what's going on around them.  Price going up despite seemingly bad news is bullish.  Sometimes it seems hard to remember that.

    Where Do We Stand on a Longer-Term Chart of the Markets

    This chart of the S&P 500 Index goes
    back to 2002. The thick horizontal red line marks the naturally occurring support and resistance line
    going back to 2003 and 2004. Just above
    that is the 50% retracement level of the recent decline. So, while price has rallied nicely for more than five months off the recent lows, overhead resistance may soon come into play. Click the chart to see a bigger version.

    090913 Long Term SP500

    The chart above also shows that Volume has
    been a little light; but some of that is seasonal. I expect volume to
    pick-up soon. The question, of course, is whether prices will trade
    higher or lower when that happens.

    Average Daily Change Plummets.

    Bespoke reminds that one of the most remarkable characteristics of last year's market crash was its daily volatility.  At its peak, the 50-Day Average Absolute Daily Change of the S&P 500 surpassed 4%.  That means that the Market gained or lost 4% to 5% of its total value on a daily basis for two months. 

    In contrast, the 50-Day Average Absolute Daily Change of the S&P 500 is now under 1%.  This is the lowest level since July of last year.  Markets fall much faster than they rise, so it's no surprise that this number has gone down significantly as the S&P rallied off of its lows.

    090913 Bespoke Chart Showing Absolute Daily Percent Change for the SP500

    Shorter-Term, The Market Looks Strong.

    The next chart overlays the NASDAQ's Net New Highs on top of the index
    itself. This measure counts the number of NASDAQ Components making new
    52-week highs, and subtracts the number of NASDAQ components
    making new 52-week lows . So, we get more Net New Highs when the markets
    are doing better. As it stands, A lot of NASDAQ Components are making highs for the year. 
    Yet, there are slightly less Net New Highs than we saw in mid-July. So,
    while this is a little picky, it does constitute a negative
    divergence. Consequently, I'm watching for a drop-off in this measure
    as a potential early warning indicator of impending market weakness.

    090913 NASDAQ Net New Highs

    It's been easier to make money on the long side for a long time. I sense a lot of the smart money is daytrading long exposure. In other words, they're happy to trade long, but they're not as happy to take that risk home overnight.

    Business Posts Moving the Markets that I Found Interesting This Week:

    • Is Commercial Real Estate Lurking as Next Potential Mortgage Crisis? (WSJ)
    • The Failure Caucus: These Guys are Rooting for the Economy to Fail. (Slate)
    • Evolving a Business Strategy: New Book on Revising Business Plans.  (Forbes)
    • Inquiry Stokes Unease on High-Speed Trading. (DealBook)
    • Is the World Losing Faith in the U.S. Dollar? (Wharton)
    • Budget Crisis Causing States to Close Offices a-Day-at-a-Time. (TDB)
    • Doug Kass: The Next Move Down? It's Different This Time. (TheStreet)
    • More Posts Moving the Markets.

    Lighter Ideas and Fun Links that I Found Interesting This Week

    • Are Video games the Future of Education? (Economist)
    • New Form of Rehab: Center Treats Web Addicts. (NYTimes)
    • How Teams of Geeks Crack Spy Trade. (WSJ)
    • VMware May Be Microsoft’s Top Rival After Google. (NYTimes)
    • YouTube Said to Be in Talks To Offer Full-Length Pay Movies. (NYTimes)
    • Apple's Next Big Thing: Still the iPhone; But the Carrier is New. (TheStreet)
    • iPhones Overload AT&T's Network, Angering Customers. (NYTimes)
    • More Posts with Lighter Ideas and Fun Links.