Current Affairs

  • Market Commentary from June 13th, 2008

    Wall Street is expecting another volatile week.  In addition to our regular complement of oil price spikes, Dollar worries, inflation fears and economic reports on home building and wholesales prices … this week, the biggest news might be the quarterly earnings reports from Morgan Stanley (MS), Goldman Sachs (GS), and Lehman Brothers (LEH).

    Currently, just 33% of stocks in the S&P 500 are above their 50-day moving averages.  Much of this weakness has come from the Financial sector.  Only 17% of Financials are above their 50-day moving averages.  To see how ugly that sector has been, take a look at the charts of the Financial Sector SPDR (XLF) and the Banking Index ($BKX).  Both are back at, or near, their lows. 

    But, next week also has Phi Day.  What?  Your friendly Fibonacci traders may note that June 18 is 6-18 (and everyone knows how important .618 is in trading).  If not, then you haven't spent time at Prechter's site.  Even if you don't believe it, enough traders watch the 61.8% retracement level, it is worth monitoring.  For example, check out the current chart on the Dow.
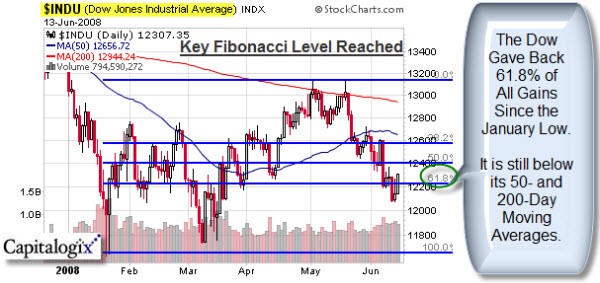
    080613 INDU Fib Level 600p
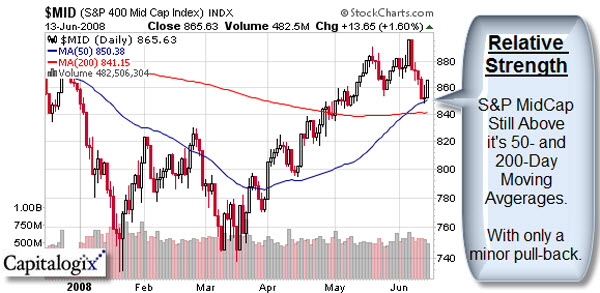
    Of course, not all US Equity Indices have fallen that far.  In contrast, note the relative strength of the S&P MidCap Index.

    080613 MID Relative Strength 600p

    Here are some of the things that caught my eye this week:

  • Virgin America(n)

    Fuel costs have certainly affected the average American.  It is possible that these added costs might have an even bigger effect on another American (as in, the airline).  Industry-wide losses for airlines are blamed on fuel cost too. And AA is no exception.

    While I was on a American Airlines flight, recently, I overheard two flight attendants talking.  The topic was that they were worried that AA was going to get bought by Virgin.  Of course, US airlines can't be purchased by foreign concerns.  However, they meant Virgin America.  At first, I didn't think much about it.

    They noted that some very senior AA alumns had high positions there.  And that rumors were that the first condition of the purported deal was that Virgin didn't want American Eagle (which is now being shopped).

    While I certainly have no inside information, or positions in any of these companies, I thought it was worth mentioning.

    AMR, American's parent company, recently said they are not in danger of bankruptcy.  However, the airline industry is certainly hurting. 

    For some additional context, here is an article that describes the current state of affairs and where Virgin's chief sees more industry failures coming.  Also, here is a recent BusinessWeek interview with AA's ex-head Robert Crandall.

    Something to keep an eye on …

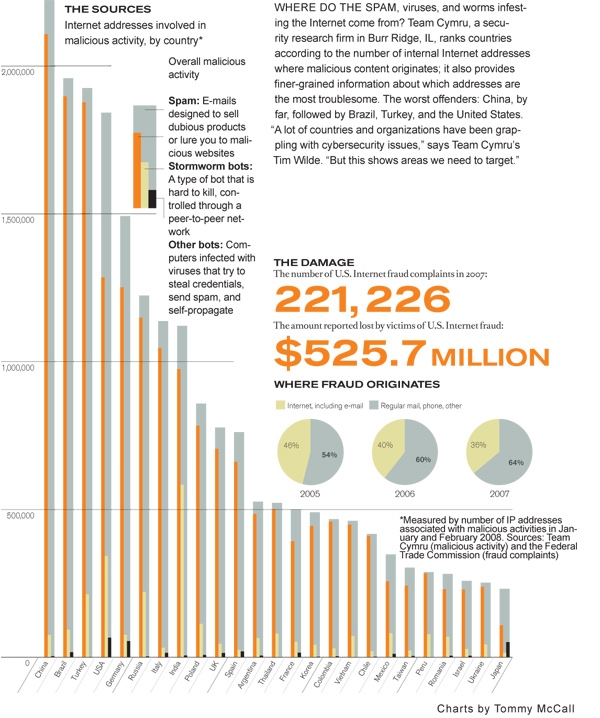
  • Where Does All the Spam Come From?

    Yesterday I got over 400 spam e-mail messages.  Either I spend way too much time in questionable chat-rooms, or the technologies they use for spam, viruses, worms, etc., are getting better and more efficient.

    As for me, I use an anti-spam product called Cloudmark.  It is the best I've seen; so the spam wasn't a problem … just a growing trend.

    On a positive note, new technology is often exploited first in fringe areas (malware, porn, etc.).  I expect that many of the things we curse about the power and sophistication of these techniques are soon harnessed to solve many problems and issues that we haven't yet thought possible.

    So, on a related note, it reminded me that I just saw a nice piece on where spam comes from.  Here is the graphic.

    Spam_chart_x600
    Source: MIT Technology Review.

  • Market Commentary as of June 6th, 2008

    This week the Markets
    tried to rally several times.  Unfortunately for the Bulls, none of
    these attempts worked.  And Friday's move down was the worst for the
    market in a year-and-a-half.

    So the headlines are "another week
    of a weak dollar, rising oil prices and falling markets."  One of the
    key take-aways, from my perspective, is that the Markets are not
    responding as resiliently to bad economic data as they had a few weeks
    ago.

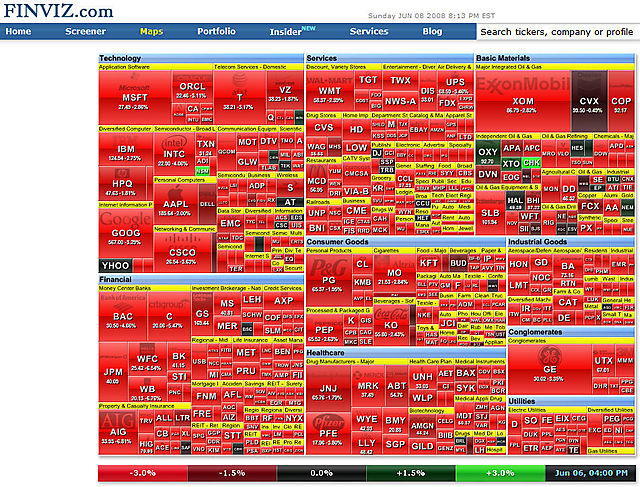
    You don't have to look much farther than this chart from FinViz.com.
    080606 Red Heat Map from FinViz

    Also, something I'm hearing more of are questions about whether you can trust the government's economic numbers?  Some people are
    saying that key measures have been distorted lately.

    Some things that caught my eye this week:

  • Game Theory (or not) On the “Price is Right”

    Here is a short clip from the TV show the "Price is Right".  The YouTube post bills it as the dumbest contestant ever.  In any case, it was funny.

    Here is the direct link for that video.

    I felt sorry for the contestant, even though I was laughing.

    Schadenfreude can be a funny thing; it always makes me think of a song from the show "Avenue Q".  Bet it makes you smile.

    Here is the direct link for that video.

  • Americans Starting to Feel Gas Pains

    Stratfor reports that car-loving Americans drove 11 billion fewer miles in March than they
    did a year earlier. The 4.3 percent decline is the first year-on-year decline since the
    1979 oil shock, and the sharpest decline ever. From: A Record-Setting Change in Driving Habits.  Zogby says behavior is changing because of demand elasticity (big words for drive less if it costs more).

    Oil prices have hit new highs and other commodity prices remain high. Obviously this is having an economic impact; but we should start seeing political and geopolitical impact. The first signs will be internal unrest and serious economic dislocations. The second will be interstate competition for resources.

    From a trader's perspective, it is important to determine whether oil is topping in price. One aspect of that is the amount of oil at sea in tankers. Stratfor reports that tanker rates surged recently, but not consumption. Oil holders, at highs, put their cargo on ships to try to time their sale on the spot market. When a lot of people do that there is a hidden overhang of supply. Something to think about.

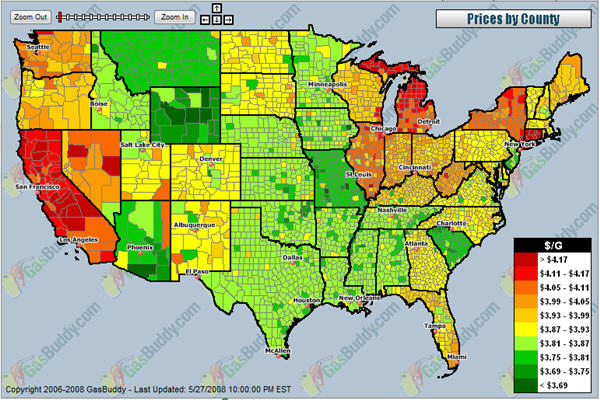
    From a consumer's perspective, I'm amazed how often I hear people talk about the price of gas.  Here is an interesting way to compare prices.

    GasBuddy Price Heatmap
    GasBuddy has other features as well.  For example, here is a link to the lowest price found in Dallas.