
When there’s uncertainty and fear, I often find it helpful to step back and look at things from a broader perspective. In this case, it’s looking at the boom in the stock market over the past 15 years.
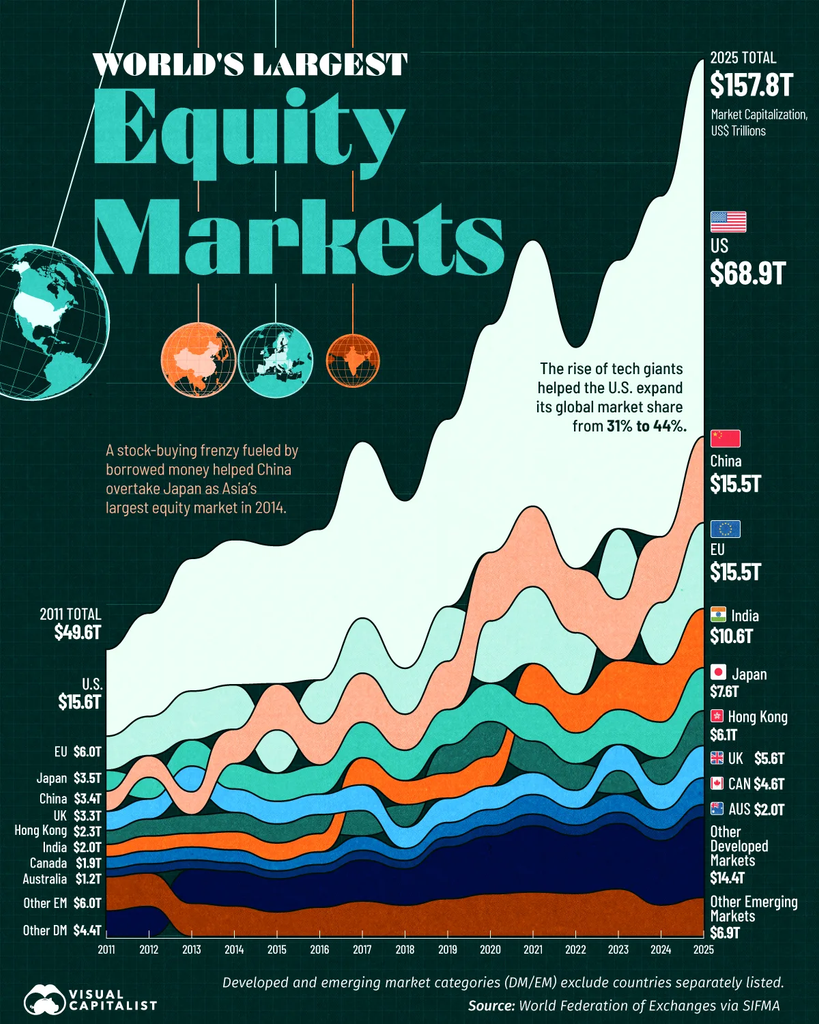
At first glance, it’s nice to see the relative growth in prosperity. A reminder that, overall, things keep improving.
One of the things I like about this chart is that it makes a complicated idea feel pretty simple:
The financial world you’re investing in today isn’t the same financial world you were investing in 10 or 15 years ago.
Look at how the world’s largest stock markets have shifted since 2011. The U.S. has remained dominant, but the relative size and importance of other markets have changed dramatically. China grew rapidly. India has climbed the rankings. Japan and major European markets have moved around.
The leaderboard moves, and that’s worth remembering when the current market feels difficult.
There is plenty to be stressed about right now. Markets are noisy. Headlines are relentless. Some days it feels like every new piece of information is another reason to worry.
But zoom out.
Over longer periods, markets have grown, adapted, and created new opportunities. Companies that didn’t exist become enormous. Entire industries emerge. New technologies reshape economies. Capital moves toward new ideas and new opportunities.
The world changes. And, over time, it tends to get bigger and more productive along the way.
That doesn’t make the difficult periods any less difficult. It just puts them in perspective.
We tend to experience markets one day at a time, while progress happens over decades.
That’s an important distinction.
It’s also why we think about markets as adaptive systems. The patterns that worked yesterday don’t necessarily remain the patterns that matter tomorrow. The goal isn’t to predict exactly what the world will look like ten years from now.
It’s to build systems that can recognize when the world is changing — and adapt with it.
Because if this chart teaches us anything, it’s that change is constant.
Leave a Reply