Thirty years ago, the Cowboys played the Bills in the Super Bowl. As a Cowboys fan, I wanted to watch the game, but my second son was scheduled to be born that day.
Luckily, our doctor said, “if you want me to be the one to deliver your baby, you need to induce early.”
So, I got to watch the Cowboys win with my youngest in hand ... while his mother shot me angry looks as I woke him up with my screaming.
That anchors the Super Bowl as a special day for me ... but some believe it’s also a "special day" for markets.
The theory is a Super Bowl win for a team from the AFC foretells a decline in the stock market – while a win for the NFC means the stock market will rise in the coming year. There is one big caveat ... the history of that "indicator" counts the Pittsburgh Steelers as NFC because that’s where they got their start. If you accept that caveat, it has been on the money 33 years out of 41 - an 80% success rate. Sounds good, right?
Come on ... you know better!
There is no substantial evidence to suggest that the outcome of the Super Bowl has any significant impact on stock market returns.
The stock market is driven by many factors, including economic data, company earnings, and overall market sentiment, rather than the outcome of a single sporting event.
Ultimately, it’s important to recognize that the stock market is a complex system – and that no single event, such as the Super Bowl, can predict its performance. While the Super Bowl may be a fun event and a source of excitement for many people, it’s not a reliable indicator of stock market returns.
Rationally, we understand that football and the stock market have nothing in common. And we probably intuitively understand that correlation ≠ causation. Yet, we crave order and look for signs that make markets seem more predictable.
The problem with randomness is that it can appear meaningful.
Wall Street is, unfortunately, inundated with theories that attempt to predict the performance of the stock market and the economy. The only difference between this and other theories is that we openly recognize the ridiculousness of this indicator.
More people than you would hope, or guess, attempt to forecast the market based on gut, ancient wisdom, and prayers.
While hope and prayer are good things ... They aren’t good trading strategies.
As goofy as it sounds, some of these “far-fetched” theories perform better than professional money managers with immense capital, research teams, and decades of experience.
Here is something to ponder...
What percentage of active managers beat the S&P 500 in any given year?
... Now, what percentage beat the S&P 500 over 15 years?
The percentage of active managers who beat the S&P 500 in any given year can vary, but it is typically low. According to research by S&P Dow Jones Indices, the majority of active managers underperform the S&P 500 over the long term.
For example, in 2020, only 24.5% of large-cap fund managers outperformed the S&P 500. In 2019, the figure was slightly higher at 28.2%, but in 2018 it was just 17.2%. These figures are representative of a broader trend in which a relatively small percentage of active managers outperform the benchmark index in any given year.
It's worth noting that these figures represent the average performance of active managers across all market segments and time periods. The percentage of managers who outperform the S&P 500 in any given year can be influenced by a number of factors, including the overall performance of the stock market, the specific market segment being analyzed, and the time period being considered.
In conclusion, while there are some active managers who outperform the S&P 500 in any given year, the majority of them underperform the benchmark index over the long term.
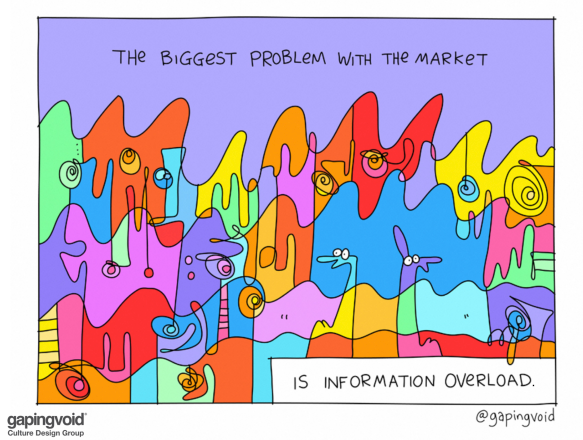
There’s simply too much information out there for us to digest, process, rank, and use appropriately.
In 2009, I wrote an article about how things aren’t always what they appear to be. In it, I mentioned the human predisposition to find patterns in data. At the time, I was still analyzing and marking up charts looking for patterns ... but I was also using early AI and computers to find better patterns and remove my fear, greed, and discretionary mistakes.
I suspect that the desire to find patterns is the same element of human nature that leads people to become superstitious, read their horoscope, or go to a fortuneteller. It is also the reason so many authors and speakers sell access to their chart patterns that supposedly work. The successes are much more startling than the failures. So the successes stand out. -"Things Aren't Always What They Appear To Be"
Today, my stance is even more extreme. Every second you spend looking at a market is a second wasted.
There are people beating the markets — not by using the Super Bowl Indicator ... they’re doing it with more algorithms and better technology.
There will never be less data or slower markets.
Onwards.
Comments
The Importance of the Super Bowl
Thirty years ago, the Cowboys played the Bills in the Super Bowl. As a Cowboys fan, I wanted to watch the game, but my second son was scheduled to be born that day.
Luckily, our doctor said, “if you want me to be the one to deliver your baby, you need to induce early.”
So, I got to watch the Cowboys win with my youngest in hand ... while his mother shot me angry looks as I woke him up with my screaming.
That anchors the Super Bowl as a special day for me ... but some believe it’s also a "special day" for markets.
The theory is a Super Bowl win for a team from the AFC foretells a decline in the stock market – while a win for the NFC means the stock market will rise in the coming year. There is one big caveat ... the history of that "indicator" counts the Pittsburgh Steelers as NFC because that’s where they got their start. If you accept that caveat, it has been on the money 33 years out of 41 - an 80% success rate. Sounds good, right?
Come on ... you know better!
There is no substantial evidence to suggest that the outcome of the Super Bowl has any significant impact on stock market returns.
The stock market is driven by many factors, including economic data, company earnings, and overall market sentiment, rather than the outcome of a single sporting event.
Ultimately, it’s important to recognize that the stock market is a complex system – and that no single event, such as the Super Bowl, can predict its performance. While the Super Bowl may be a fun event and a source of excitement for many people, it’s not a reliable indicator of stock market returns.
Rationally, we understand that football and the stock market have nothing in common. And we probably intuitively understand that correlation ≠ causation. Yet, we crave order and look for signs that make markets seem more predictable.
The problem with randomness is that it can appear meaningful.
Wall Street is, unfortunately, inundated with theories that attempt to predict the performance of the stock market and the economy. The only difference between this and other theories is that we openly recognize the ridiculousness of this indicator.
More people than you would hope, or guess, attempt to forecast the market based on gut, ancient wisdom, and prayers.
While hope and prayer are good things ... They aren’t good trading strategies.
As goofy as it sounds, some of these “far-fetched” theories perform better than professional money managers with immense capital, research teams, and decades of experience.
Here is something to ponder...
What percentage of active managers beat the S&P 500 in any given year?
... Now, what percentage beat the S&P 500 over 15 years?
The percentage of active managers who beat the S&P 500 in any given year can vary, but it is typically low. According to research by S&P Dow Jones Indices, the majority of active managers underperform the S&P 500 over the long term.
For example, in 2020, only 24.5% of large-cap fund managers outperformed the S&P 500. In 2019, the figure was slightly higher at 28.2%, but in 2018 it was just 17.2%. These figures are representative of a broader trend in which a relatively small percentage of active managers outperform the benchmark index in any given year.
It's worth noting that these figures represent the average performance of active managers across all market segments and time periods. The percentage of managers who outperform the S&P 500 in any given year can be influenced by a number of factors, including the overall performance of the stock market, the specific market segment being analyzed, and the time period being considered.
In conclusion, while there are some active managers who outperform the S&P 500 in any given year, the majority of them underperform the benchmark index over the long term.
There’s simply too much information out there for us to digest, process, rank, and use appropriately.
In 2009, I wrote an article about how things aren’t always what they appear to be. In it, I mentioned the human predisposition to find patterns in data. At the time, I was still analyzing and marking up charts looking for patterns ... but I was also using early AI and computers to find better patterns and remove my fear, greed, and discretionary mistakes.
I suspect that the desire to find patterns is the same element of human nature that leads people to become superstitious, read their horoscope, or go to a fortuneteller. It is also the reason so many authors and speakers sell access to their chart patterns that supposedly work. The successes are much more startling than the failures. So the successes stand out. -"Things Aren't Always What They Appear To Be"
Today, my stance is even more extreme. Every second you spend looking at a market is a second wasted.
There are people beating the markets — not by using the Super Bowl Indicator ... they’re doing it with more algorithms and better technology.
The Importance of the Super Bowl
Thirty years ago, the Cowboys played the Bills in the Super Bowl. As a Cowboys fan, I wanted to watch the game, but my second son was scheduled to be born that day.
Luckily, our doctor said, “if you want me to be the one to deliver your baby, you need to induce early.”
So, I got to watch the Cowboys win with my youngest in hand ... while his mother shot me angry looks as I woke him up with my screaming.
That anchors the Super Bowl as a special day for me ... but some believe it’s also a "special day" for markets.
The theory is a Super Bowl win for a team from the AFC foretells a decline in the stock market – while a win for the NFC means the stock market will rise in the coming year. There is one big caveat ... the history of that "indicator" counts the Pittsburgh Steelers as NFC because that’s where they got their start. If you accept that caveat, it has been on the money 33 years out of 41 - an 80% success rate. Sounds good, right?
Come on ... you know better!
There is no substantial evidence to suggest that the outcome of the Super Bowl has any significant impact on stock market returns.
The stock market is driven by many factors, including economic data, company earnings, and overall market sentiment, rather than the outcome of a single sporting event.
Ultimately, it’s important to recognize that the stock market is a complex system – and that no single event, such as the Super Bowl, can predict its performance. While the Super Bowl may be a fun event and a source of excitement for many people, it’s not a reliable indicator of stock market returns.
Here are some other “fun” stock market fallacies:
Back to Reality
Rationally, we understand that football and the stock market have nothing in common. And we probably intuitively understand that correlation ≠ causation. Yet, we crave order and look for signs that make markets seem more predictable.
The problem with randomness is that it can appear meaningful.
Wall Street is, unfortunately, inundated with theories that attempt to predict the performance of the stock market and the economy. The only difference between this and other theories is that we openly recognize the ridiculousness of this indicator.
More people than you would hope, or guess, attempt to forecast the market based on gut, ancient wisdom, and prayers.
While hope and prayer are good things ... They aren’t good trading strategies.
As goofy as it sounds, some of these “far-fetched” theories perform better than professional money managers with immense capital, research teams, and decades of experience.
Here is something to ponder...
What percentage of active managers beat the S&P 500 in any given year?
... Now, what percentage beat the S&P 500 over 15 years?
The percentage of active managers who beat the S&P 500 in any given year can vary, but it is typically low. According to research by S&P Dow Jones Indices, the majority of active managers underperform the S&P 500 over the long term.
For example, in 2020, only 24.5% of large-cap fund managers outperformed the S&P 500. In 2019, the figure was slightly higher at 28.2%, but in 2018 it was just 17.2%. These figures are representative of a broader trend in which a relatively small percentage of active managers outperform the benchmark index in any given year.
Over 15 years, the answer is about 5% of active managers are able to beat the performance of the S&P 500 Index (and that’s in a predominantly bull market). That’s significantly worse than chance. It means that, in general, what they’re doing is hurting, not helping.
It's worth noting that these figures represent the average performance of active managers across all market segments and time periods. The percentage of managers who outperform the S&P 500 in any given year can be influenced by a number of factors, including the overall performance of the stock market, the specific market segment being analyzed, and the time period being considered.
In conclusion, while there are some active managers who outperform the S&P 500 in any given year, the majority of them underperform the benchmark index over the long term.
via Gaping Void
There’s simply too much information out there for us to digest, process, rank, and use appropriately.
In 2009, I wrote an article about how things aren’t always what they appear to be. In it, I mentioned the human predisposition to find patterns in data. At the time, I was still analyzing and marking up charts looking for patterns ... but I was also using early AI and computers to find better patterns and remove my fear, greed, and discretionary mistakes.
Today, my stance is even more extreme. Every second you spend looking at a market is a second wasted.
There are people beating the markets — not by using the Super Bowl Indicator ... they’re doing it with more algorithms and better technology.
There will never be less data or slower markets.
Onwards.
Posted at 06:31 PM in Business, Current Affairs, Ideas, Just for Fun, Market Commentary, Trading, Trading Tools | Permalink
Reblog (0)