Emotion is a funny thing. You know it isn't good in trading. Apparently, it isn't good for politicians either.
After getting 'worked up', he is quoted as saying: “Donald Trump may be a rat, but I have no desire to copulate with him.”
via YouTube.

Thoughts about the markets, automated trading algorithms, artificial intelligence, and lots of other stuff
Emotion is a funny thing. You know it isn't good in trading. Apparently, it isn't good for politicians either.
After getting 'worked up', he is quoted as saying: “Donald Trump may be a rat, but I have no desire to copulate with him.”
via YouTube.
I was just in a San Francisco restaurant for a lunch meeting. We had a burger and a salad – the bill came to $60. It was a good burger … but come on!
Likewise, it's no secret, Bay Area home prices are among the highest in the country.
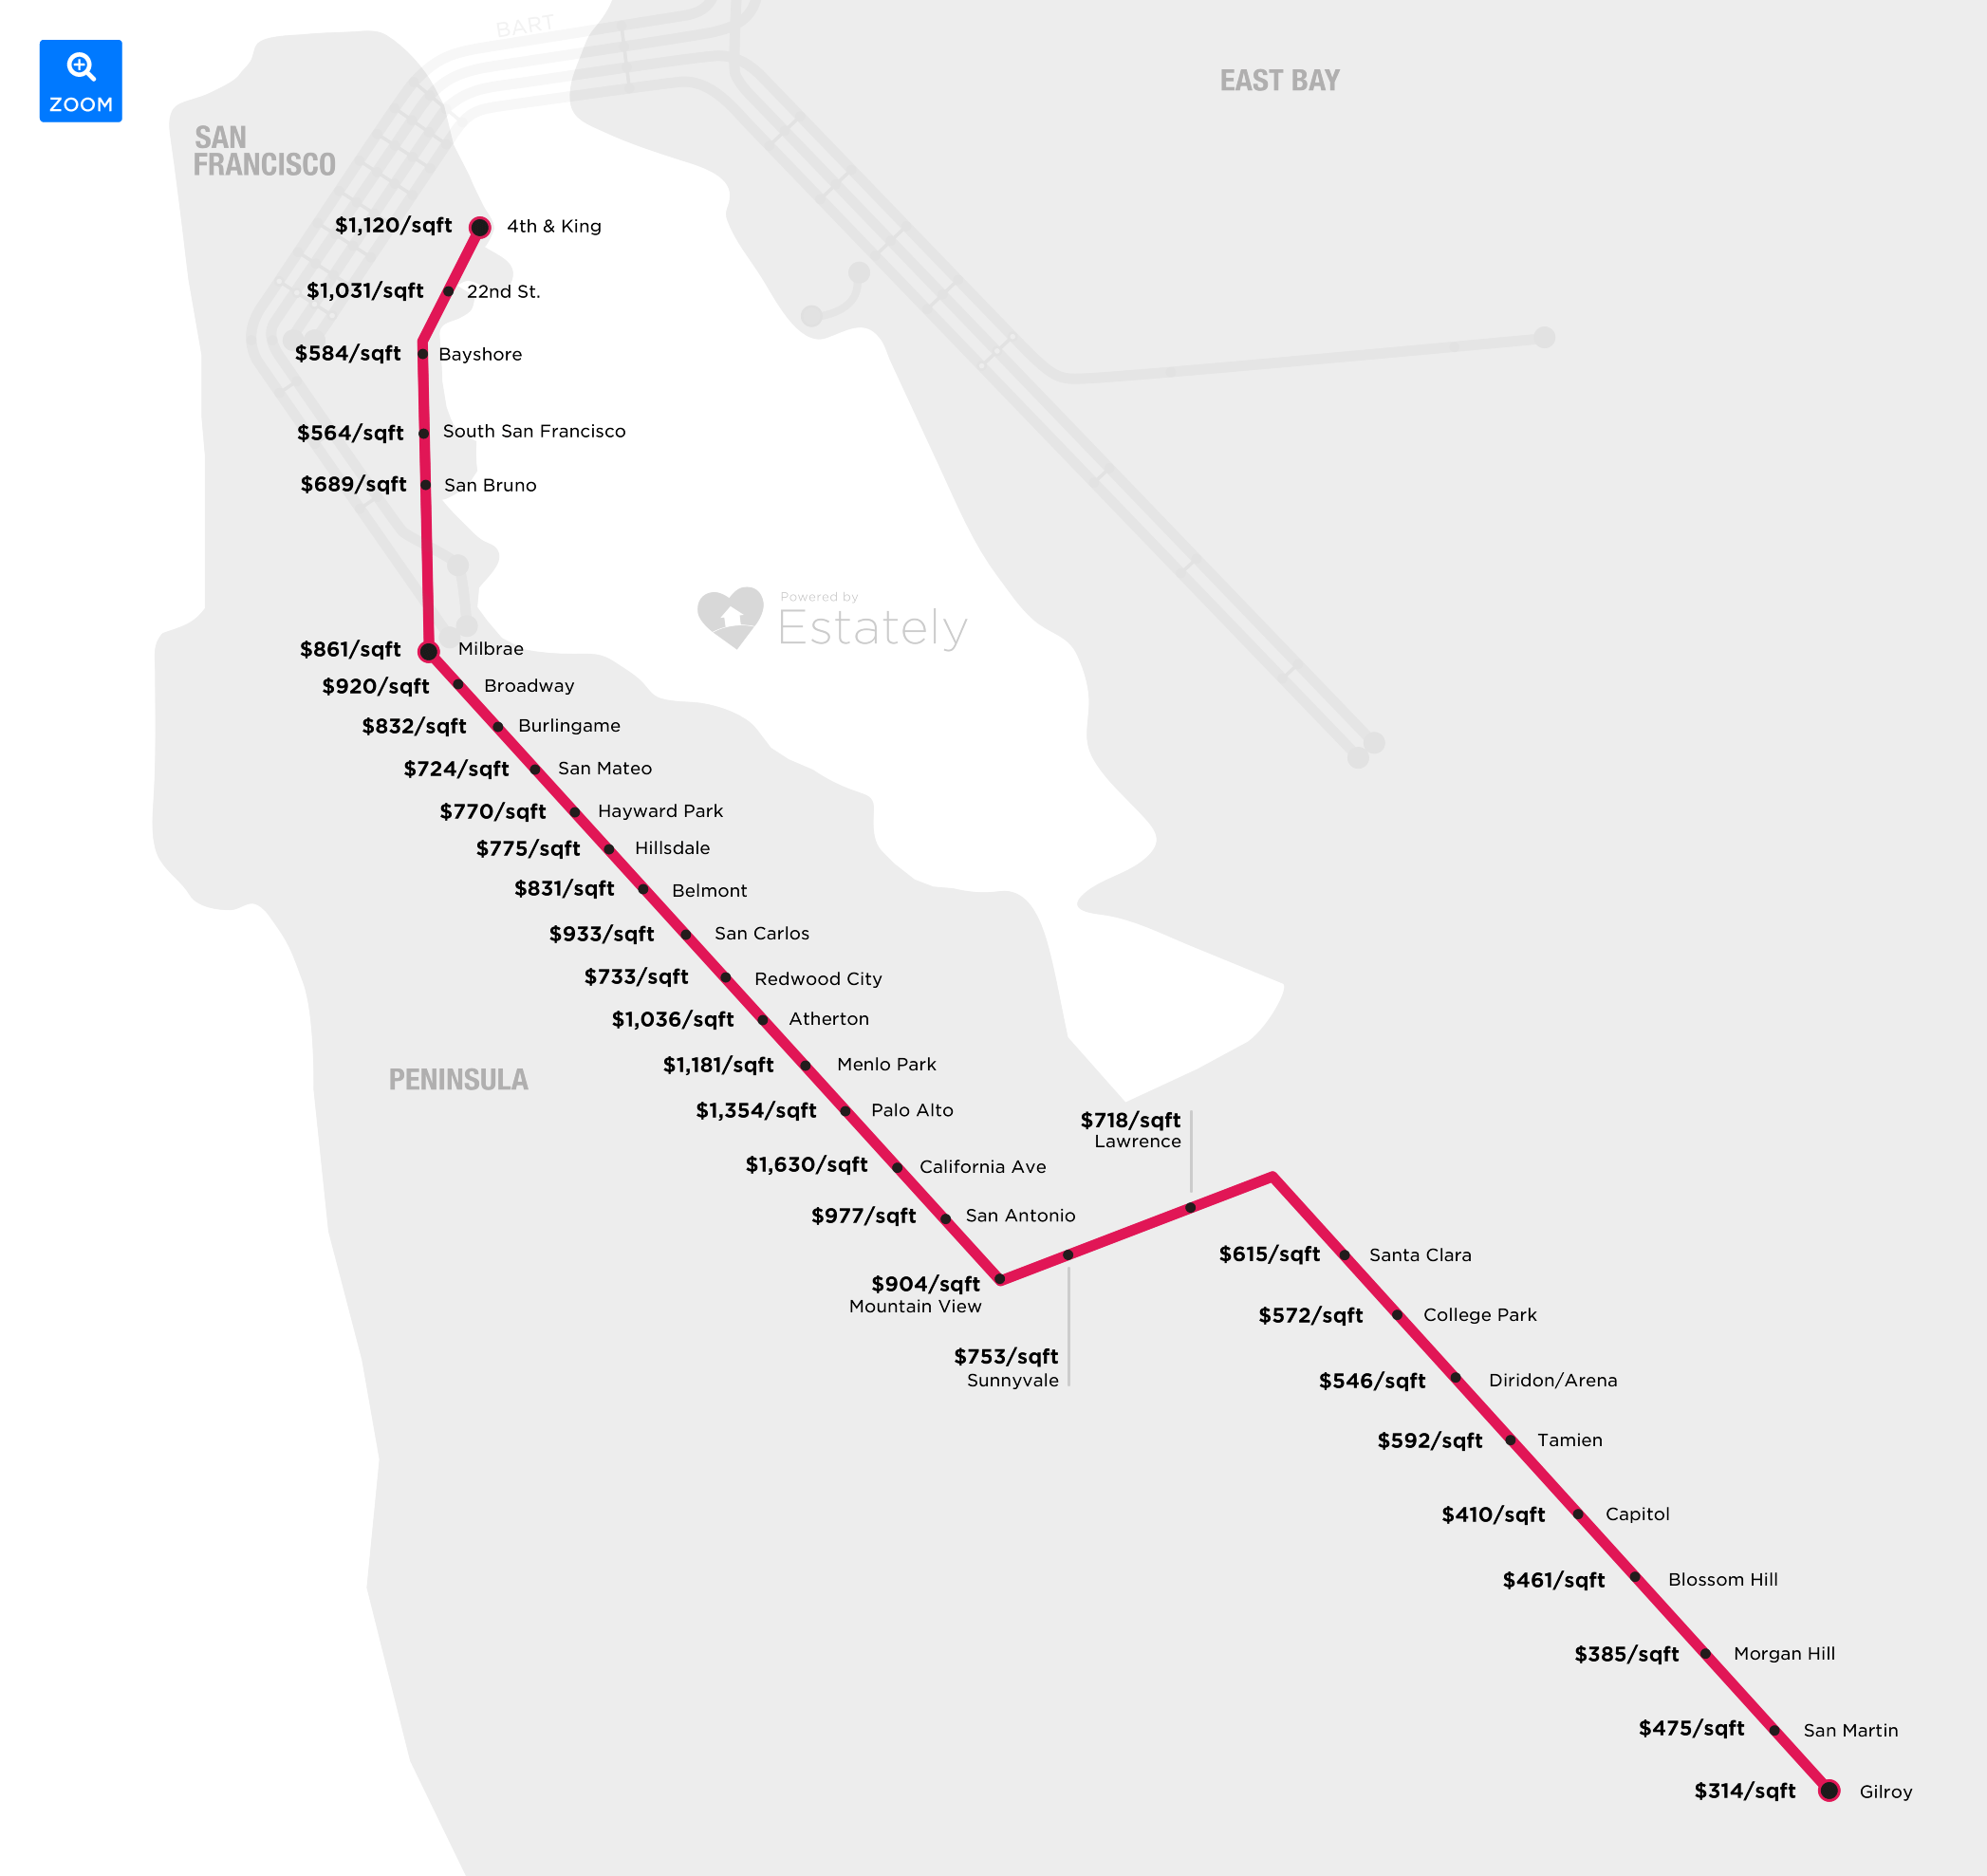
Below is a chart that shows how those prices vary depending on which Caltrain stop a home is near. To do this, Estately Real Estate Search analyzed the last six months of home sales for houses, townhouses, and condos that were within a one-mile radius of each transit stop, then broke them down by price per square foot.
Take a look:
At an average of $1,630 per square foot, Caltrain's California Avenue stop, in Palo Alto, is the Bay Area's most expensive transit stop based on nearby home prices.
So, do you feel better about real estate prices in your area?
I was just in a San Francisco restaurant for a lunch meeting. We had a burger and a salad – the bill came to $60. It was a good burger … but come on!
Likewise, it's no secret, Bay Area home prices are among the highest in the country.
Below is a chart that shows how those prices vary depending on which Caltrain stop a home is near. To do this, Estately Real Estate Search analyzed the last six months of home sales for houses, townhouses, and condos that were within a one-mile radius of each transit stop, then broke them down by price per square foot.
Take a look:
At an average of $1,630 per square foot, Caltrain's California Avenue stop, in Palo Alto, is the Bay Area's most expensive transit stop based on nearby home prices.
So, do you feel better about real estate prices in your area?
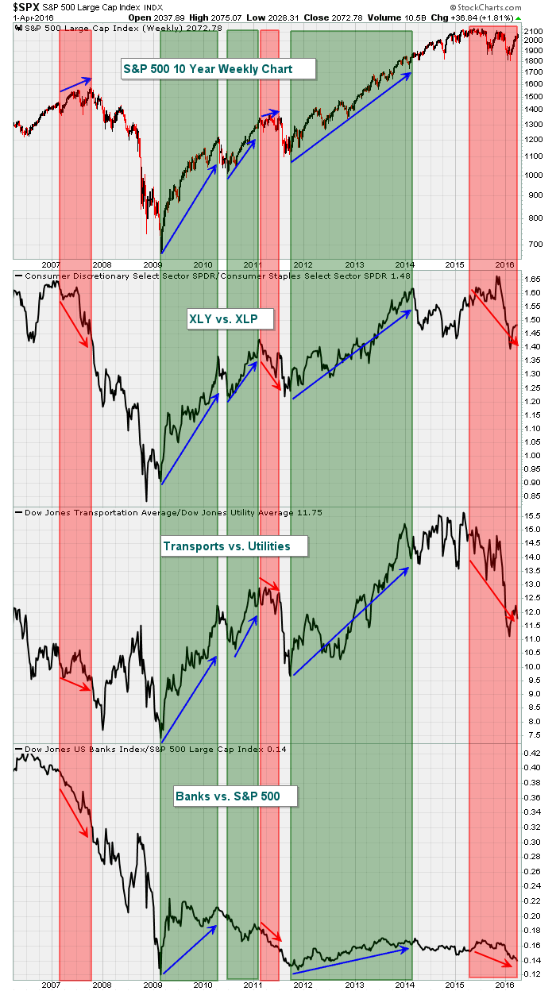
Tom Bowley posted some analysis that caught my attention. He used sector rotation analysis to question the sustainability of the current market rally.
Basically, the chart below shows red shaded areas to highlight warning signs that appeared at the end of the prior bull market in 2007 and also warned of the 2011 correction.
Currently, the S&P 500 is in the midst of a very solid rally off the February 11th bottom. The rally in February was supported by rotation to "risk on" areas of the market.
The March rally, however, has lost its luster in terms of relative ratios as money has turned more cautious.
It doesn't mean we can't go higher, but it perhaps lowers the odds a little.
Take a look at the chart:
Tom Bowley posted some analysis that caught my attention. He used sector rotation analysis to question the sustainability of the current market rally.
Basically, the chart below shows red shaded areas to highlight warning signs that appeared at the end of the prior bull market in 2007 and also warned of the 2011 correction.
Currently, the S&P 500 is in the midst of a very solid rally off the February 11th bottom. The rally in February was supported by rotation to "risk on" areas of the market.
The March rally, however, has lost its luster in terms of relative ratios as money has turned more cautious.
It doesn't mean we can't go higher, but it perhaps lowers the odds a little.
Take a look at the chart:
The best way to make dreams come true is to wake up.
Here are some of the posts that caught my eye. Hope you find something interesting.
The best way to make dreams come true is to wake up.
Here are some of the posts that caught my eye. Hope you find something interesting.
This week, Lance Roberts posted "Only 4% From Record Highs" on RealInvestmentAdvice.com.
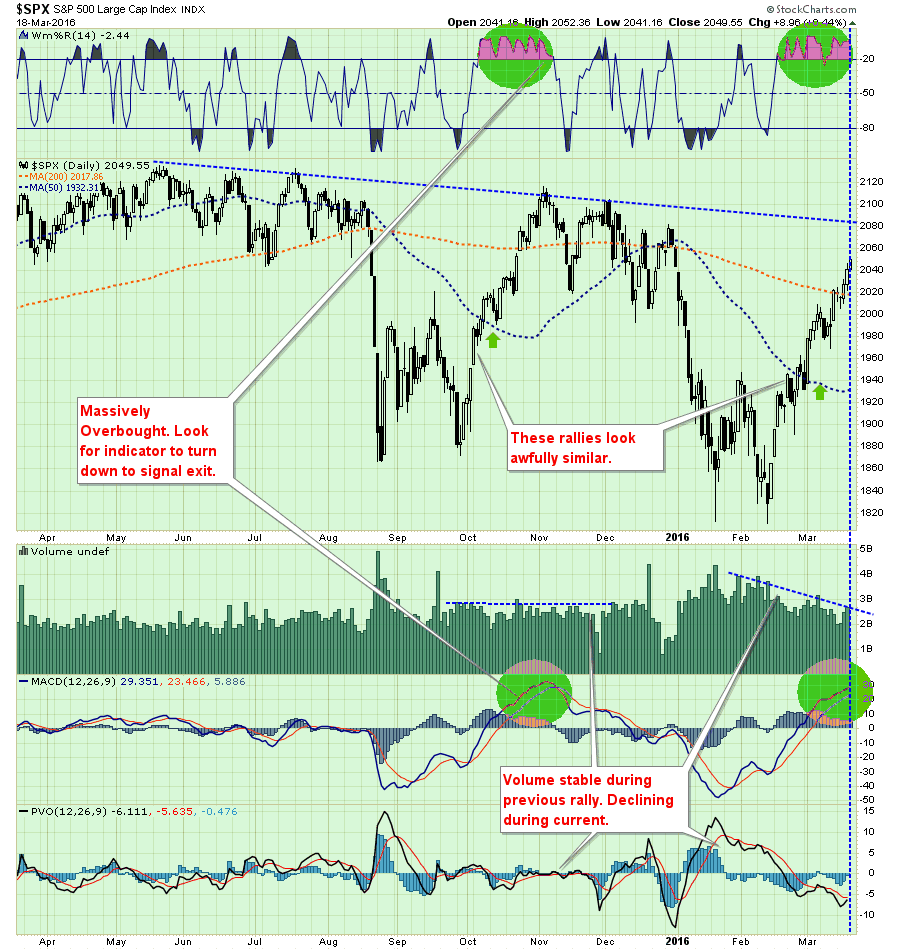
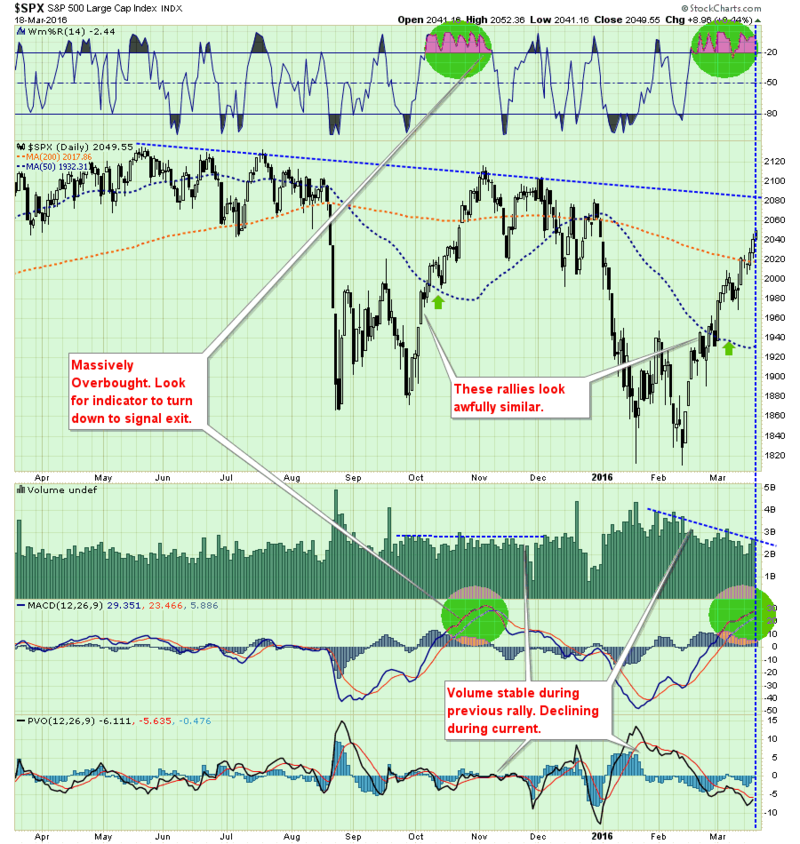
“While my “emotions” are currently screaming to start increasing equity allocations at this juncture, there are several reasons why my discipline is keeping me from doing so currently:
- The market is GROSSLY overbought in the short-term and will have either a mild corrective process or consolidation to allow for an increase in equity exposure.
- Negative trends are still in place which suggests the current rally, while significant, remains within the context of a reflexive rally.
- Volume is declining on the rally suggesting a lack of conviction.
- This rally looks very similar to the rally last October except the fundamentals are substantially weaker.”
Here is the chart (with his notations) that caught my eye.
The question it poses is whether enough “technical repair” has been completed to warrant an increase in equity exposure in portfolios? Does the “risk” that the current “bear market” rally is nearer completion outweigh the possibility currently the markets are changing back to a “bull market”?
In other words, does the “risk” that the current “bear market” rally is nearer completion outweigh the possibility currently the markets are changing back to a “bull market”?
As we approach summer, the seasonal weakness of the markets will likely resurface as the reality of Central Bank interventions are digested and focus once again returns to the real driver of asset prices longer term – profits.
“There have been three great inventions since the beginning of time: fire, the wheel, and Central Banking.” – Will Rogers
Happy Spring!