
Last week, while I was in Portland, I noticed that gas prices were over $5, compared to my normal $3 in Texas. And in Texas, even $3 feels high.
Gas prices rank among the most emotionally resonant economic indicators — visible on every corner, cited in earnings calls, and embedded in consumer sentiment surveys for decades.
It made me wonder: where are gas prices the highest … and why? But that doesn’t tell the whole story. Instead, it might be better to look at the average annual gas spend per driver. Below is a chart showing that analysis for each state.
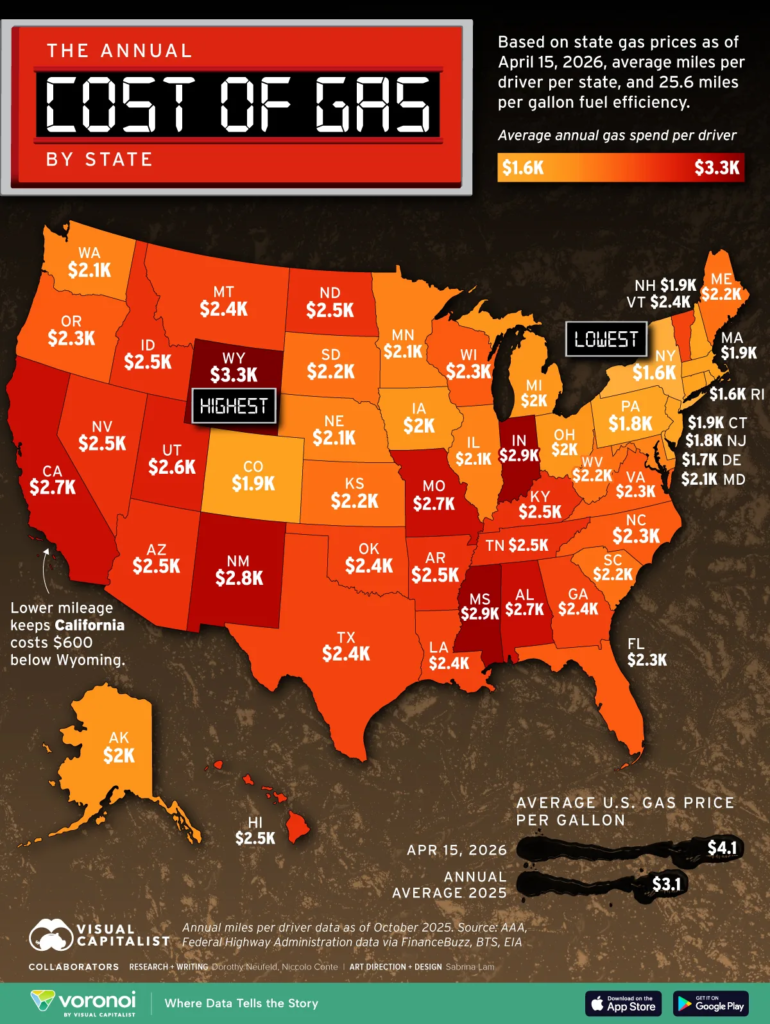
U.S. drivers spend between $1.6K and $3.3K per year on gas, depending on the state. The spread is significant. What’s counterintuitive is that gas prices aren’t the primary driving factor.
A more useful lens looks beyond the price at the pump and measures the total annual fuel spend against actual miles driven, because often, behavior matters more than cost.
High prices grab attention, but distance quietly does the damage.
As a result, rural states like Wyoming rank highest in annual fuel spend, while Northeast states rank near the bottom — not because gas is cheap there, but because residents drive significantly less.
When prices spike, the narrative focuses on the pump. Consumers feel it immediately. For some, it reshapes household budgets, travel plans, and business decisions.
But this kind of breakdown shows that travel patterns often matter more than price alone.
California is the clearest illustration. The state has the highest per-gallon prices in the country, yet ranks sixth in annual fuel spend at $2,705. Shorter average driving distances (11,780 miles per year versus a national average of 13,916) meaningfully offset the price premium.
The same pattern shows up in reverse in the Northeast.
In New York, drivers spend just $1,582 annually on fuel (about $700 less than the national average) largely because they drive fewer miles (9,185 per year). States like Rhode Island, Delaware, and New Jersey follow a similar pattern, where shorter commutes offset higher gas prices.
Driving The Point Home
Gas prices tell only part of the story. What really drives cost is how much we drive (and, to some extent, that’s demand-elastic). So, while high prices grab attention, decisions to minimize costs by doing less (or doing differently) have wide-ranging impacts.
The other article this week considered what happened to Spirit Airlines. Obviously, fuel costs mattered; too bad they couldn’t have just operated shorter flights … Expect to see more examples of tough choices because of demand-elasticity and rising costs.
Leave a Reply