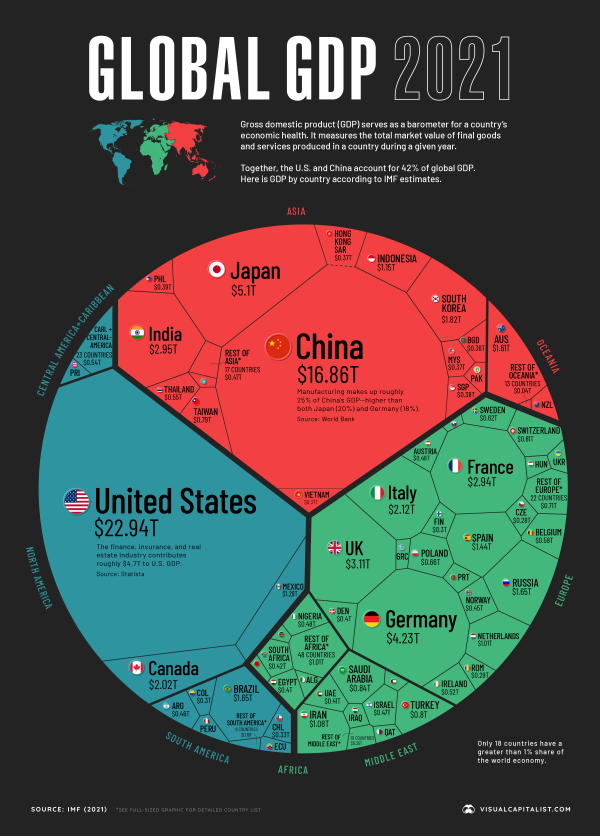
There are numerous ways to look at or measure the global economy (including trade blocs, big industry movers, or debt). Another way to get a global overview is to compare GDP.
When trading was slower and more deeply tied to an investor mindset, economics played a more significant role in fundamental analysis. As the holding period (or "time in trade") shrinks, there is less focus on predicting markets over the long term … and more on determining which techniques are making money now.
Even though markets are not the same as the economy, on a macro scale, many believe that it is possible to create value by understanding and the global economy better.
With that, take a look at the $94 trillion world economy, divided by region.
 via visualcapitalist
Some thoughts:
- Global GDP was $87 trillion in 2019 and $84 trillion in 2020. So, while COVID did negatively impact GDP initially, it has rebounded and risen again as if 2020 hadn't interrupted the trend.
- Since 2018, China has been slowly gaining ground on the U.S.'s lead
- Global GDP isn't zero-sum, so countries doing better doesn't necessarily mean other countries are doing worse
- The top four countries – U.S., China, Japan, and Germany – make up over half of the world's GDP.
- Based on GDP growth, Libya, Guyana, Macao, the Maldives, and Ireland have the world's fastest-growing economies.
To put these numbers in perspective, the world economy was approximately $3 trillion in 1970, and GDP is estimated to double again by 2050.
Crazy stuff.

Leave a Reply