Uncategorized

  • Do You Trust the Government’s Economic Numbers?

    Can you trust the government's economic numbers?  Some people are saying that key measures have been distorted.  At question, among others, the:

    • Consumer Price Index: which tracks inflation at the retail level
    • Gross Domestic Product: which tracks overall economic growth, and
    • Unemployment Figures: which tracks jobs and indirectly measures corporate health.

    We've been given low inflation numbers.  This makes GDP look more robust because it implies that there was increased output, rather than increased prices.  However, with the rising cost of energy and commodities, a bigger portion of each paycheck is going to necessities.  It is not just gasoline either; a quick trip to the grocery store shows what has happened to the price of wheat, rice, and eggs.  At the same time, credit is tightening and the value of their homes are going down.  So, consumers aren't just paying more, they have less to spend.

    The unemployment numbers are artfully adjusted, though perhaps misleading.  For example, the government's number showed gains (rather than losses) in the number of jobs in financial services and construction sectors last month.  Let me remind you how many banks, brokerage houses and funds are closing, or at least laying people off or re-structuring.  And construction hasn't been booming lately, has it?  To see how they did it (hint, birth/death adjustment), read Alan Abelson's piece in Barrons.  Also check-out The Week and Bill Gary in Commodity Information Systems' Price Perceptions. For an interesting take on the recent Congressional Hearings (and Jim Roger's response) it is worth reading RIghtSide Commentary

  • Weekly Market Commentary from 5/23/08

    Wow that was quick. The Dow lost 500 points this week, as oil continued to rise, housing continued its decline, and inflation and recession fears flared. No wonder the markets went down.

    From a technical perspective,
    several markets also lost their trend support levels.  Adding insult to
    injury, not only did the markets fail to stay above their 200-Day
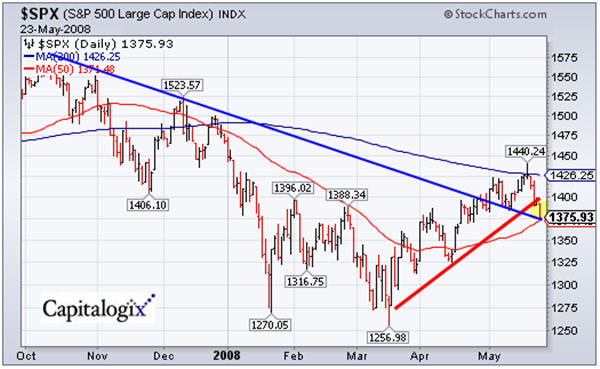
    moving averages … most markets are now back under their 50-Day moving averages.

    This is a daily chart of the S&P 500 Index with price just beneath the hotly contested 1400 level.  It shows that price broke below the uptrend from March (shown by the thick red diagonal line); but is resting just above the down-trend support line from October (the thick blue diagonal line).

    080523 SPX Decision

    We are now oversold no multiple time frames. However, we'll see how long it lasts.  Bulls are quick to point out that we went from overbought to oversold too quickly, with low volume, and not much re-testing.  Bears respond: that's the definition of weakness.

    Of course, most market watchers were expecting a pull-back. As noted, the markets had run-up quite a bit and were facing their 200-Day moving averages. It's quite normal to stop there once you had such a long multi-month move upward. Also, the lack of negative sentiment deprived the rally of fuel. It will be interesting to see the Commitment of Traders data and new bull bear percentage when it comes out later this week.

    Things that caught my eye this week:

    This should be an interesting week; respond intelligently.