Here is a quick video about Inspiration and Entrepreneurship.
It begins with the question, “Do you remember when you were a kid…And you thought you could do anything?” and then proceeds to tell the viewer that the hope possessed as children is renewable as an adult, and as an entrepreneur. It is well-done, fun, and only takes about two minutes. So, seize the day … and watch the video.
Did the Government blink? By that I'm asking whether you think they passed a Stimulus Plan because it was well-considered and the right thing to do … or because we were about to make new market lows and key decision-makers believed that preserving confidence, at any cost, was the move to make?
Last week I said I was more interested in how the Market reacted to the Stimulus Plan, than in the plan itself. Well, the Market sent a pretty strong message this week. It sold-off and is sitting just above the support areas set by the October and November lows.
The Stimulus Plan is hard for me to understand on several levels. My sense is that it is work-in-progress and should be looked at only as a first-step to figure-out what it is going to take to get things moving in a positive direction.
Here is a different (and more fun) explanation that is worth watching.
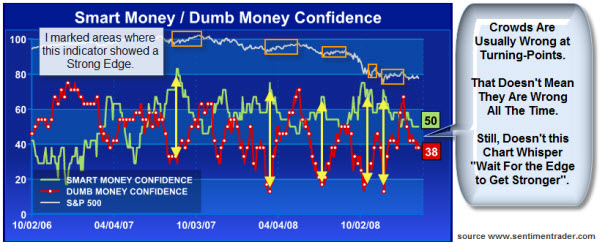
This chart compares the bets made by small traders (a.k.a. the "Dumb Money"), to those of large commercial hedgers (a.k.a. the "Smart Money").
In practice, Confidence Index readings rarely get below 30% or above 70% (they usually stay between 40% and 60%). When they move outside of those bands, it's time to pay attention.
Even more noteworthy is when there is a wide confidence spread with bearish bets by the Dumb Money and bullish bets by the Smart Money. This type of sentiment
spread only happens a few times a year. The chart below shows that we often get substantial bullish reversals when that happens.
I marked those occurrences with Yellow Arrows and marked the corresponding rallies in the S&P 500 using Orange Boxes. As you can see, this has been a valuable indicator to follow. So, what is it telling us now?
Conventional trading wisdom says that Crowds are usually wrong at turning-points. That doesn't mean they are wrong all the time (especially when the Smart Money agrees). So, perhaps this chart whispers "wait for the edge to get stronger". I don't like how weak the Smart Money confidence is given all the intervention help the Markets received and how long Market lows have held.
Here Are A Few Of The Business Posts I Found Interesting This Week:
Stimulus Battle Has Just Begun … Both Fiscally And Politically. (WP)
The Stimulus Plans: Comparison of what the House and Senate Proposed. (WSJ)
THE PUBLICATION OF THIS BLOG IS FOR YOUR INFORMATION AND AMUSEMENT ONLY. THE AUTHOR IS NOT SOLICITING ANY ACTION BASED UPON IT, NOR IS HE SUGGESTING THAT IT REPRESENTS, UNDER ANY CIRCUMSTANCES, A RECOMMENDATION TO BUY OR SELL ANY SECURITY.
THE CONTENT OF THIS LETTER IS DERIVED FROM INFORMATION AND SOURCES BELIEVED TO BE RELIABLE, BUT THE AUTHOR MAKES NO REPRESENTATION THAT IT IS COMPLETE OR ERROR-FREE, AND IT SHOULD NOT BE RELIED UPON AS SUCH. IN FACT, MUCH OF WHAT IS ON THIS SITE IS THERE BECAUSE IT I THOUGHT IT WAS INTERESTING OR HUMOROUS RATHER THAN BECAUSE IT IS MY OPINION. EVEN WHEN AN OPINION IS STATED, HOWEVER, IT IS TO BE TAKEN AS THE AUTHORS OPINION AS SHAPED BY HIS EXPERIENCE, RATHER THAN A STATEMENT OF FACTS. THE AUTHOR MAY HAVE INVESTMENT POSITIONS, LONG OR SHORT, IN ANY SECURITIES MENTIONED, WHICH MAY BE CHANGED AT ANY TIME FOR ANY REASON.
CAPITALOGIX, HOWARD GETSON, NOR ANY RELATED ENTITY OR PERSON CANNOT AND DOES NOT MAKE ANY REPRESENTATION AS TO THE ACCURACY OF THIS INFORMATION ON THIS SITE OR LINKS TO OTHER SITES OR SOURCES. PLEASE VERIFY ALL INFORMATION YOURSELF.
THIS MATERIAL IS PROVIDED FOR INFORMATIONAL PURPOSES ONLY AND SHOULD NOT BE CONSTRUED IN ANY WAY AS AN INDUCEMENT TO INVEST. AN INVESTMENT IN SECURITIES OR FUTURES IS SPECULATIVE AND INVOLVES A HIGH DEGREE OF RISK .
NEITHER HOWARD GETSON NOR CAPITALOGIX IS A REGISTERED INVESTMENT ADVISOR OR A BROKER/DEALER.
RISKS OF SECURITY FUTURES TRANSACTIONS: TRADING SECURITY FUTURES CONTRACTS MAY NOT BE SUITABLE FOR ALL INVESTORS. YOU MAY LOSE A SUBSTANTIAL AMOUNT OF MONEY IN A VERY SHORT PERIOD OF TIME. THE AMOUNT YOU MAY LOSE IS POTENTIALLY UNLIMITED AND CAN EXCEED THE AMOUNT YOU ORIGINALLY DEPOSIT WITH YOUR BROKER. THIS IS BECAUSE FUTURES TRADING IS HIGHLY LEVERAGED, WITH A RELATIVELY SMALL AMOUNT OF MONEY USED TO ESTABLISH A POSITION IN ASSETS HAVING A MUCH GREATER VALUE. IF YOU ARE UNCOMFORTABLE WITH THIS LEVEL OF RISK, YOU SHOULD NOT TRADE SECURITY FUTURES CONTRACTS.
PAST PERFORMANCE IS NO GUARANTEE OF FUTURE RESULTS. THERE IS RISK OF LOSS AS WELL AS THE OPPORTUNITY FOR GAIN WHEN INVESTING IN SECURITIES, MANAGED FUTURES, OR FUNDS.
Can you trust the government's economic numbers? Some people are saying that key measures have been distorted. At question, among others, the:
Consumer Price Index: which tracks inflation at the retail level
Gross Domestic Product: which tracks overall economic growth, and
Unemployment Figures: which tracks jobs and indirectly measures corporate health.
We've been given low inflation numbers. This makes GDP look more robust because it implies that there was increased output, rather than increased prices. However, with the rising cost of energy and commodities, a bigger portion of each paycheck is going to necessities. It is not just gasoline either; a quick trip to the grocery store shows what has happened to the price of wheat, rice, and eggs. At the same time, credit is tightening and the value of their homes are going down. So, consumers aren't just paying more, they have less to spend.
The unemployment numbers are artfully adjusted, though perhaps misleading. For example, the government's number showed gains (rather than losses) in the number of jobs in financial services and construction sectors last month. Let me remind you how many banks, brokerage houses and funds are closing, or at least laying people off or re-structuring. And construction hasn't been booming lately, has it? To see how they did it (hint, birth/death adjustment), read Alan Abelson's piece in Barrons. Also check-out The Week and Bill Gary in Commodity Information Systems' Price Perceptions. For an interesting take on the recent Congressional Hearings (and Jim Roger's response) it is worth reading RIghtSide Commentary.
Wow that was quick. The Dow lost 500 points this week, as oil continued to rise, housing continued its decline, and inflation and recession fears flared. No wonder the markets went down.
From a technical perspective,
several markets also lost their trend support levels. Adding insult to
injury, not only did the markets fail to stay above their 200-Day
moving averages … most markets are now back under their 50-Day moving averages.
This is a daily chart of the S&P 500 Index with price just beneath the hotly contested 1400 level. It shows that price broke below the uptrend from March (shown by the thick red diagonal line); but is resting just above the down-trend support line from October (the thick blue diagonal line).
We are now oversold no multiple time frames. However, we'll see how long it lasts. Bulls are quick to point out that we went from overbought to oversold too quickly, with low volume, and not much re-testing. Bears respond: that's the definition of weakness.
Of course, most market watchers were expecting a pull-back. As noted, the markets had run-up quite a bit and were facing their 200-Day moving averages. It's quite normal to stop there once you had such a long multi-month move upward. Also, the lack of negative sentiment deprived the rally of fuel. It will be interesting to see the Commitment of Traders data and new bull bear percentage when it comes out later this week.