Inflation is a tax on capital and it slowly eats away at your portfolio. It also takes a chunk out of your wallet.
With the printing presses running in Washington, how can you tell if things are getting more expensive? It isn't a trick question, you simply compare prices with what they used to be.
While it is something to watch, I'm not hearing much concern. What about you?
American Airlines and US Airways announced their merger this week. The combination will produce the world’s largest airline, based on combined revenue.
American recently freshened its 45 year old logo, which now includes a stylized U.S. flag image on aircraft tails, the long-time signature look of US Airways planes.
I
travel a lot, so I have had the opportunity to talk about this with
many airline employees. Clearly, they are not happy. A pilot said the
problem is that both companies had angry employee cultures … and
smaller troughs make pigs meaner.
Welcome to the friendly skies.
Here are some of the posts that caught my eye. Hope you find something interesting.
There is more … This quote from the Washingtonian's Sophie Gilbert says a lot about Washington.
To press seated just below the [inauguration] podium, in front of the 'President's Own' Marine Corps Band, it was evident that the band wasn't actually playing during [Beyoncé's rendition of the national anthem] — even though band director Colonel Michael J. Colburn was conducting energetically and the band members mimicked blowing into their instruments.
Here are some of the posts that caught my eye. Hope you find something interesting.
Last week they put on quite a show. Alerted by the buzz of social media, the eyes of Wall Street turned to CNBC. What they witnessed was verbal fisticuffs that could rival anything on reality
TV.
Here is the video of a spat between two hedge fund magnates with a decade-long grudge
against each other. Apparently, name-calling is fair in battles such as this.
One step above "I'm rubber and you're glue; anything you say bounces off me and sticks to you." Fun to watch if you like things like that.
Last week I got an insightful lesson from someone I'd never heard of before. His name is Itay Talgam, and he used to conduct the Israel Philharmonic Orchestra.
He was the keynote presenter on the opening night of a business conference … and somewhat surprisingly his message was about leadership.
Some people take the word "conductor"
and assume it means "leader." However,
taken a different way, "conductor" might
mean "connector."
Neither is "right," but which would you consciously choose for it to mean for you, your business, or your trading?
To figure out what conductors do, we watched some videos of well-known conductors conducting their orchestras.
Some were the center of attention, some helped highlight the performers, while others focused on connecting the audience to the music.
Some were stiff, others almost danced with their orchestra and the audience.
Likewise, some were control freaks who micro-managed every nuance of a performance, while others simply let the orchestra play.
Some showed passion; others showed control.
Again, there are countless variations; and the point is that it was easy for each of us to choose what seemed right (and what didn't). Obviously, this works as a metaphor for business, interactions with people, or even how you trade and manage a portfolio.
If you were hiring a conductor, what would you be looking for, and how would you want them to engage ?
With that in mind (time for a little introspection), how do
you show-up, and what do you do? Are there other ways for you to perform your roles and duties that might get better results?
On a different topic, when you experience great classical music … who should get the credit?
Acceptable answers might include the conductor, the orchestra, the composer, even the audience.
Assuming that a conductor should get their fair share of the credit and blame for a performance, what do they do (or what could they do) to impact the results?
Obviously, the conductor is the focal point letting people know when to do the thing that they do. So there's clearly a communication and coordination component. Taken too far, and it strips some of the "magic" from the performers and the performance.
According to Talgam, the best conductors manage the process, while leaving the details to the performers. This allows them a fair bit of control, without the stifling effect on innovation or art.
From my perspective the same is true in trading. I don't want a portfolio manager to be the trading system … instead I want a dynamic and adaptive selection of the right systems at the right time.
One of the examples was that a flute player asked the conductor how they would know it was time for them to come in … The conductor's answer was "it's time to come in when you can no longer stand being out."
Leonard Bernstein
was shown as an example of a great conductor. After working with the Vienna Philharmonic for many years, some of the best performances occurred while he did apparently little.
Upon closer inspection, you could see that he was sending them cues using: facial expressions, the pace of his breathing, a nod of his head, the movement of his body, the direction of his gaze, and through countless
other little things.
Obviously, you can't rely on such things at the beginning, but once people really know what to do, one of the best things you can do is help them find opportunities to do what they do best, and then to get out of the way to let them do it.
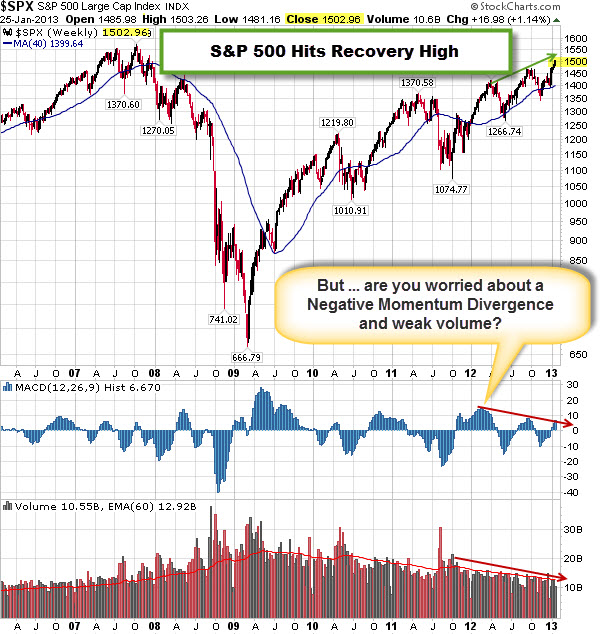
The benchmark Index extended its rally to eight days.
This winning streak is the longest in eight years and left the S&P 500 just 4% beneath its all-time closing high of 1,565.15 (set on October 9, 2007).
Meanwhile, some technicians will note the less than enthusiastic volume and the negative divergence (where recent price highs happened with lower momentum). These are often taken as early topping indicators (or signs of weakness).
Apple's stock has now dropped 37% since its September high of $702.10.
As a result, Exxon reclaimed its status as the world's most valuable company.
Do you attribute this to Apple's weakness … or an early warning that 'smart-money' is taking risk off the table?
Remember: Price is the Primary Indicator.
What do you think is the most bullish indicator of our markets?
It's not a trick question; the answer is "price". Despite the uncertainty about the economy, the markets have held-up nicely throughout this rally. And that, in-and-of-itself, is bullish.
It doesn't matter what technical analysis indicator you use (increasing negative divergences and selling on down days … or less positive momentum and market breadth), the markets have given us a clear message recently. Price is the primary indicator, and it has stayed above support.
Traders learn strong uptrends tend to trump bearish divergences. But it bears watching.


