Trading

  • Phi on Fibonacci and Markets

    FIBONACCI SPIRAL drawing
    As noted, 6/18 is "Phi Day" for Fibonacci aficionados. 

    So, here is a link to a description of the sequence on Prechter's Elliott Wave website.

    And here is a follow-up article.

  • “It’s About Time” — Or, Isn’t it?

    There is a difference between working on a problem and focusing on a solution.  Thus, trying to improve performance is different than focusing on limiting losses. 

    Einstein said: "We cannot solve our problems with the same thinking we used when we created them."

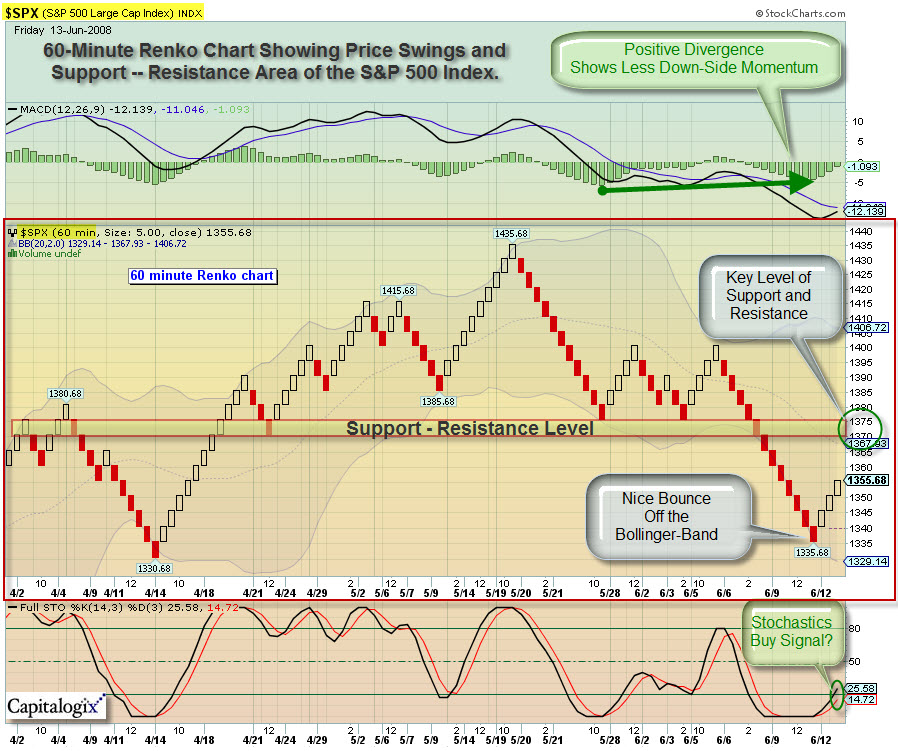
    It got me thinking. Most trading charts are time-based (meaning that price change is measured against time).  But maybe looking at price change in other ways would provide a different perspective.

     
    There are several interesting techniques gaining favor among technical traders.  These include measuring price change based on a certain volume traded or a constant range of directional movement.  Here is a link to a brief article about this in StockCharts.com.
     
    In some respects, these are "smoothing" techniques.  Nonetheless, they present a different picture of the market, and are something worth investigating.
     
    Here is how the S&P 500 Index looks like in one of these charts.
     
    080613 SPX Renko Chart
  • Market Commentary from June 13th, 2008

    Wall Street is expecting another volatile week.  In addition to our regular complement of oil price spikes, Dollar worries, inflation fears and economic reports on home building and wholesales prices … this week, the biggest news might be the quarterly earnings reports from Morgan Stanley (MS), Goldman Sachs (GS), and Lehman Brothers (LEH).

    Currently, just 33% of stocks in the S&P 500 are above their 50-day moving averages.  Much of this weakness has come from the Financial sector.  Only 17% of Financials are above their 50-day moving averages.  To see how ugly that sector has been, take a look at the charts of the Financial Sector SPDR (XLF) and the Banking Index ($BKX).  Both are back at, or near, their lows. 

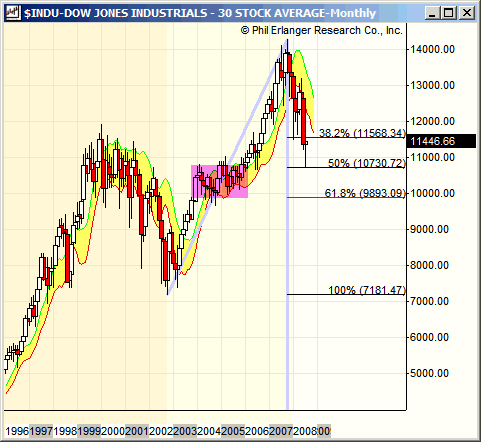
    But, next week also has Phi Day.  What?  Your friendly Fibonacci traders may note that June 18 is 6-18 (and everyone knows how important .618 is in trading).  If not, then you haven't spent time at Prechter's site.  Even if you don't believe it, enough traders watch the 61.8% retracement level, it is worth monitoring.  For example, check out the current chart on the Dow.

    080613 INDU Fib Level 600p
    Of course, not all US Equity Indices have fallen that far.  In contrast, note the relative strength of the S&P MidCap Index.

    080613 MID Relative Strength 600p

    Here are some of the things that caught my eye this week:

  • Why Analysis Is Often Flawed

    Imagine thousands of researchers asked to analyze the market, or an
    event like a Fed Statement. Each is searching for a substantial
    answer. Trouble is, there's bias towards "substantial."

    Is there really
    an "Answer"? Doesn't each tick, each move, produce new questions?

    It's
    sometimes like a "Magic Eye" hidden picture. You are searching for the
    vision and all you see is nonsensical chaos. Yet when seen from the right perspective, and with the right focus,
    there is a higher order and the picture becomes clear.

    Time plays a
    role here. Timeframe plays a role here. But so does knowing when the signal to
    noise ratio tells you not to pay attention. Sometimes noise is just noise.

    I've
    been thinking about how the market whispers when to play offense, when
    to play defense, and when not to play at all.  What gives us a clue
    that something meaningful is happening?  Is it:

    • Price Moves;
    • Volume;
    • When Some Moving Average is Above or Below Some Other;
    • Sentiment
    • Fundamental Data
    • Technical Indicators?

    As someone who's played this game for a long time, I'm not looking for magic bullets.  But if I wasn't willing to look, it would be difficult find.  So, model-building and testing will continue.  I'll share more as the picture comes into focus.

  • Weekly Market Commentary from 5/16/08

    2008_bear_on_bull_payback_time
    Is The Bear Still Lurking?

    Great market action for bulls recently.  If this has been a head-fake, it certainly was a convincing one.

    The major US Equity Indices are all moving up to their 2008 highs – into their 200-day moving averages.

    There has been a prolonged rally off the March lows, so you are going to hear lots of bearish predictors. It makes sense from the standpoint of price, time and logic.

    Right?

    For example:

    1. We are now "overbought" and the rally is approaching the 61.8% Fibonacci Retracement level;
    2. A re-test of the 50-Day moving average is a likely next move;
    3. That the Put/Call ratio is too bullish, and so is dumb-money confidence levels;
    4. The VIX is simply too low, and readings at these levels often precede big drops;
    5. Consumer confidence levels are at dangerously low levels (add inflation, housing, and gas …); and
    6. We are still in that range-bound congestion area, and the longer we stay here the more we spend upside momentum.

    But, you have to trade what the market brings you.  And the market has digested bad news well recently. More importantly, we know that markets don’t have to trade logically.  So keep your eyes open and respond intelligently.

    Here are some of the things I read this week.

  • What is Your Intention?

    Mellensmartblow_rough_sea
    Fear, greed and hope comprise the Bermuda Triangle of trading. Many dreams were battered or lost because of them.

    In trading, my goal is to make and keep money, consistently. It isn’t to be right, or clever, or even creative. Reducing human bias and error are benefits of using automated trading systems; and ultimately that helps us intelligently respond to the markets.

    How does that apply to life?

    Oh, a small question …

    A friend of mine called me this week to share a thought. He said that he was trying to stop simply responding automatically to situations. Instead, he was going to consciously focus on his "intention" before responding.

    Imagine how different the world would occur to you if you brought "intention" into focus instead of mindlessly surrendering to your first feelings and actions.

    Triumphant_man_on_water_200p_2
    My first reaction often is to ask "what is the best next step?" Perhaps you do something similar? On many levels that is a resourceful question. Yet, what would happen if, instead, you brought your intention into focus and asked what role you could play to best support that intention?

    Your role directly affects the options you perceive.

    Let me know how that works for you.