Trading

  • Weekly Commentary through September 26th, 2008

    This was a tough week for the markets. Strangely, it might soon prove to have been a good week for the markets as well.

    So what is it going to take for the markets to finally bounce?  History shows
    that most intermediate or long-term bottoms are characterized by panic
    selling, hopelessness, and people simply giving-up.  If that is the standard, then we may be close.

    Here is some of the evidence of the fear, uncertainty, doubt that often accompanies bottoms:

    • This week reversed most gains from the prior week's rally and short-squeeze.
    • The markets continue to flirt with lows for the year. 
    • Because of the volatility and gaps, trading simply hasn't been normal recently. 
    • The economy and the markets dominate news and popular culture. 
    • This week, the President of the United States basically said that
      if a radical bail-out wasn't done, right now, it would damage our
      economy – and many others across the globe. 

    However, as bad as the markets did last week, they held up
    reasonably well considering how much bad news there has been and how
    close to the edge things really were (or are). Also, while markets went
    down, it was on lower volume than last week, and we didn't break last
    week's low. 

    The Calm After the StormIt's
    also probably worth noting that, historically, periods of great
    volatility are often followed by periods of much less volatility.

    With that in mind, I do believe that the government will reach a
    reasonable compromise to end the "Deal – or No Deal" situation very
    quickly. It's also likely that this agreement and the liquidity that it
    brings will give the markets some room to breathe and some fuel for a
    meaningful rally.

    On the other hand, there is a long way to go
    from here to recovery. Some people see this as the end of the crisis.
    At best, I see this as the end of the first step on the road to
    recovery.

    You Can't Bounce Until you Hit Bottom
    There are many corollaries in nature. This troubling time created a
    clearing. Much of the fear, uncertainty, doubt, and baggage from past
    mistakes are being wiped away. Firms are closing, the landscape is
    changing, Wall Street and our economy will literally never be the same
    again. And, yet, this kind of clearing is often the catalyst to new
    beginnings and fast growth.

    Noise Reduction
    When creating automated trading systems, one of the things that becomes
    increasingly important is to recognize the difference between signal
    and noise. Right now, there's a lot of noise. The markets, market
    players, and even governments are spooked. Under those circumstances,
    it doesn't take much to stir things up.

    The bailout and worldwide
    cooperation can be looked at as noise reduction. Temporarily, there
    will be a forced and tenuous peace. The hope is that as things calm
    down, people will make decisions from a stronger position (or at least
    from a position that's less fearful than where they are now).

    Remember, a journey of a thousand miles begins with one step.  Here's to progress.

  • Weekly Commentary through September 19th, 2008

    Wow!  That was some week.  As I went back through what happened, it is hard to believe it all happened in one week.  There was:

    Here is what it looked like on a weekly chart of the Dow.

    080819 Dow Weekly

    Wall Street experienced several of the best and worst days in its history.  Fear spiked early in the week, and there were two days that saw markets lose
    about 5%.  Individually, each of those down-moves was bigger than
    anything we've seen since 9/11. Then after what many will call a Key Reversal Day, there was a breakaway gap higher of more than 4% on Friday. 

    Somehow, foreign markets were even more
    volatile. For example Russia's RTS Index
    had a 17% loss in one day, and had trading halted for two days, only to
    gain 22% when it opened again on Friday.

    It all happened last week.

    So, where do we find ourselves?  Somehow, pretty much where we were at the beginning of the week.  Except you know something important happened.  It even trickled down to Saturday Night Live.  This week there were several SNL skits related to the market and the market action.  People were spooked.  More importantly, governments were spooked.

    We are witnessing unprecedented market action.  I suspect that they will be writing about this period in history books.

    Hopefully the actions taken by the government will ultimately have a positive impact. From a trader's perspective, it sure hasn't been easy.

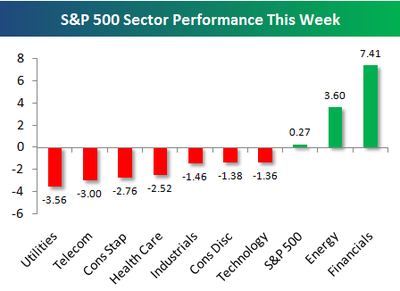
    So, how did the interventions affect the markets. One way to see is to
    look at how various sectors performed this week. This chart, from
    Bespoke, shows that Financials and Energy were the beneficiaries this week.

    0080919 S&P Sector Performance

    Here are a few of the posts I found interesting this week:

    • Bush Defends Bail-Out (WSJ)
    • "The Week That Changed American Capitalism" (Big Picture)
    • Chart Showing Big Gains in Global Markets late last week (Bespoke, FT, NYTimes)
    • Does Thursday Qualify as a Key Reversal Day? (MarketWatch, Quantifiable Edges)
    • VIX Spikes to 42 on Fear last week (VIX and More)
    • A Market Indicator that Shows What Panic Looks Like (Trader's Narrative)
    • Swenlin Analyzes recent charts looking for perspective on the Bottom (Decision Point)
    • How common is a week with multiple daily losses greater than 4% ? (Bespoke)
    • Short-Selling Ban Spreads to Foreign Markets (Big Picture)
    • Treasury to Guarantee Money Market Funds (Intl. Herald Tribune)
    • Treasury Seeks Authority to Buy $700BB of Toxic Assets (Bloomberg)
    • Interactive graphic of $1.86 Trillion of Losses in the Financial Sector this year (NYTimes)
    • Goldman Sachs and Morgan Stanley to become Bank Holding Companies (WSJ)

    And, a little bit extra:

    • SEC Bans Frowning (Financial Sense)
    • How Wall Street Lied to Its Computers (NYTimes)
    • How close did we come to Armageddon in the markets (NY Post)
    • Here is the text of the Plan Paulson presented to Congress (Kedrosky)
  • Weekly Commentary through September 12th, 2008

    Volatility has been much higher than normal.  For example, the S&P 500 index rose or fell by more than 2% on five of the nine trading days so far this month.  There were only six such days during the last 4½-year bull run.

    Yet, for all that violent flip-flopping and massive gaps in both directions, the stock market ended last week essentially flat.

    We are back near the lows for the year.  Bears had a great opportunity to plunge through important psychological levels. Everything turned red for the ride down; and then the market reversed again. Part of me wonders whether short-sellers didn't press their luck because they "fear" another Sunday bail-out (in some form or fashion).

    The big news this week was about the fall of Lehman.  Here is a simple chart showing what happened to their stock this year.

    080912 LEH ChartAs I write this, it looks like Lehman is filing for bankruptcy and that Merrill Lynch is getting sold to Bank of America.  Futures are down.

    However, a big, quick, move down – here – might be the best thing to hope for if you are bull.

    Here are a few of the posts I found interesting this week:

    And, a little bit extra:

    • Sweet Dreams in Hard Times Add to Lottery Sales (NYTimes)
    • Niederhoffer's Ten Principles of Cricket and Market Power (Daily Speculations)
    • Wisconsin man eats 23,000 Big Macs since 1972 (Chicago Tribune)
    • Lehman Replaces Palin as Wikipedia Plaything (Infectious Greed 1 and 2)
    • McCain leading Obama in prediction markets and polls (Kudlow, RealClearPolitics)
    • Retailers Using Software to Increase Sales and "motivate" employees (WSJ)
    • Has the large Hadron Collider destroyed the world yet? (Click)
    • Biologists on the verge of creating a new form of "life" (Wired)
  • Weekly Commentary through September 5th, 2008

    The bailout of Freddie & Fannie should breathe some life into markets that needed a lift. 

    That means stock
    markets around the world are breathing a little easier after a tough
    last week. For example, Russia and Taiwan each lost over 10%.

    Sometimes a picture is worth a thousand words.  This chart shows how the NASDAQ fared last week.

    080904 NQ Drop

    The chart doesn't need fancy indicators or words to tell the market's story: it went down.

    Last week I said a move down, here, wouldn't surprise me.  We got more than I expected, because it was unrelenting.  After a big gap-up to start the trading week, it was straight down from there.

    Now for the S&P 500 Index. 

    080905 SPX Trend 500p

    This chart shows the monthly displaced moving average
    channel for the S&P 500 index. It typically acts as support or resistance to the markets longer trend.  Notice how the attempted rally in August moved the
    index closer to the channel; but the market wiped-out that
    effort in just a few days of trading. 

    What about the Dow Jones industrial average?  Which economic anxieties were the catalysts as the Dow plummeted 344.65 points on Thursday ?  Was it that initial unemployment claims were near a 5-year high, the weak retail sales report, or fear of a global slow-down?

    There is probably a little more work to be done on the downside, setting-up a decent bounce.  Again, historical patterns show a year-end rally typically starts in late September or early October. And the 4-year Presidential cycle pattern also favors a year-end rally.

    Here are a few of the posts I found interesting this week:

    • U.S. Near Deal To Save Freddie and Fannie (WSJ, Washington Post)
    • Another Bank Fails: 11th this year, as Regulators shut Silver State (WSJ, FDIC)
    • Swing-Trading the Sell-Off (TradingMarkets via Forbes)
    • Who's afraid of Sovereign Wealth Funds? (Minyanville)
    • James Surowiecki on "That Uncertain Feeling" affecting the herd of investors (New Yorker)
    • Unemployment hits 6.1% and a closer look doesn't make it prettier (Dash of Insight, Portfolio)
    • Bank of Canada Offers a Downbeat Outlook while holding rates steady (NYTimes)
    • Did governments work together to save the Dollar? (Clusterstock)
    • BMW sales up 2% last month, year-over-year (Bloomberg)
    • Doug Kass says this is what market bottoms look like (Street.com)
    • Trader Mike says we're not oversold yet (Trader Mike)
    • McCain speech seen by record number of viewers (Bloomberg)
    • Apple's iPhone making gains in business users (WSJ)
    • Yahoo Below $19: Microsoft's $31 Offer is Looking Pretty Good Right Now (Silicon Alley Investor)

    And, a little bit extra:

    • Technology That Out-thinks Us: A Partner or a Master? (NYTimes)
    • Numerati: How math models improve productivity and management (BusinessWeek)
    • Lines and Bubbles and Bars, Oh My! New Ways to Sift and Visualize Data  (NYTimes)
    • Microsoft has been granted a patent on 'Page Up' and 'Page Down' keystrokes (ZDNet)
    • Invisibility Cloak becoming a reality; the challenge is seeing out of it (New Scientist, More)
    • Facebook's hottest games (Forbes)
    • Hulu Getting NBC Shows Before TV Does (Silicon Alley Investor)
    • ESPN and Electronic Arts Innovating Play-By-Play Commentary (NYTimes)
    • Google developed its own web browser called Chrome (CNet, WSJ)
    • Andy Kessler's take on what Google is really doing with Chrome (Andy Kessler)
    • Is the first Jerry Seinfeld ad for Microsoft funny?  You decide (NextWeb)
    • Download Limits: Is "all-you-can-eat" Internet a thing of the past? (ABC)
  • Weekly Commentary Charts through August 29, 2008

    Another week of big swings in thinly-traded markets.  There is a trading range in the S&P 500 where the bears defend the top (1295) and the bulls defend the bottom (1260). So far, no one is winning. Let's see which way things break; though a short-term move down here wouldn't surprise me.

    Historical patterns show a year-end rally typically starts in late September or early October. The 4-year Presidential cycle pattern also favors a year-end rally.

    Here are a few of the posts I found interesting this week:

    • Lehman in urgent talks to secure a capital injection before earnings call (UK Telegraph)
    • Worker Confidence sinks to levels of last recession (WSJ)
    • Nightmare on Wall Street: Why the Credit Crisis has lasted so long? (Economist)
    • Candidates on the Credit Crisis (Dash of Insight)
    • Does history favor Democrats' economic plan? (NYTimes)
    • Victor Niederhoffer on why the Markets continue to surprise him (Daily Speculations)
    • A positive sign for markets: 64% of stocks above their 50-day averages (Bespoke)
    • Is the "Bearish Crescendo" a contrarian sign of a market Bottom? (Shaeffers)
    • Ten factors that contribute to Market Mood Swings (Seeking Alpha)
    • To make a stock "pop" – Innovate (NYTimes)

    And, a little bit extra:

    • Great Photos from Beijing Olympics (Boston Globe, LA Times, Time, FT,The Star, S.I.)
    • The Business of College Football is probably Bigger than you think (Forbes)
    • Does it Matter that Internet Traffic is beginning to bypass the US? (NYTimes)
    • Interesting comparison of housing market price declines in various cities (Bespoke)
    • Obama's acceptance speech for Democratic Presidential Nomination (Politico, Many Eyes)
    • Air-Ball: Game Ball Delivered by Parachute; Skydivers land in Wrong Stadium (Inquirer)
    • Microsoft releases beta of a major new version of Internet Explorer (WSJ, Microsoft)