Trading

  • Weekly Commentary through November 7th, 2008

    Who (Or What) Really Controls the Markets? 

    Watching the 500-point down day following Obama's election,
    it would be easy to attribute the move to a reaction to the vote.  However,
    virtually every market
    around the globe suffered the same fate.

    When I first started trading I used to say things like, "I wonder what
    they're going to do in the morning?"  Or, "Wow, they are really trying
    to mess with people."  The point is that I anthropomorphized the market.  In
    other words, I made the Market seem like a person or a group of people
    with consciousness and intent.   

    It's easy to imagine a
    secretive group controlling things behind the scenes.  Maybe it's a
    select committee from the top investment banks.  And of course, you've
    heard of the "Plunge Protection Team", who supposedly steps in from
    time-to-time, "pressing buttons" and causing markets to dance their
    dance.

    As appealing as it is to believe that there's so much
    order and control underneath our markets, the fact that there's been so
    much correlation around the world, both to the downside and the upside,
    tells me that what is more likely in control is the fear and greed of
    the market's collective participants.

    Why is There So Much Fear? 

    Goldman Sachs forecast
    the deepest U.S. recession since the Reagan era after the unemployment
    rate climbed to the highest level in 14 years and payrolls tumbled for
    a 10th consecutive month. Ultimately, the economy has lost 1.2 million
    jobs since December, with over half of those losses in the last three
    months as the problems from the recession accelerate.

    On a related note, according to the WSJ, Goldman Sachs is approaching the share price it went public close to a decade ago. 

    081107 Japan at 26 Year Low
    While US equities market has been down recently, international markets had it worse. The fact that China just announced a 4 trillion Yuan ($586 billion) stimulus package — equivalent to nearly one-fifth of 2007 GDP
    — underlines how nervous Beijing is at the speed of its economic
    slowdown.

    And in Japan, the Nikkei hit a 26-year low a week ago (click to view chart). Forget about the lost decade, in Japan it has been the lost quarter century.

    The
    Nikkei has lost more than 20% of its value in the last month and is
    down by more than 40% for the year, capped by a 9.6% one-day loss a
    week ago. That put it lower than it was back in October 1982. 

    Yes,
    they have yo-yos in Japan too.  The Nikkei rallied 33% in 6 days this
    week, only to tank again.  As you can see, it is a small world.

  • Weekly Commentary through October 31st, 2008

    Inancial+Problems boy with sign 200p
    October was the worst month for the S&P 500 since October 1987.  The current bear market, which made its most recent low this past Monday,
    is now the fourth longest decline in the S&P 500 without a 20%
    rally (on a closing basis). Besides the 1973/1974 bear market, the only
    other times this has occurred was during the 1929-era Depression.

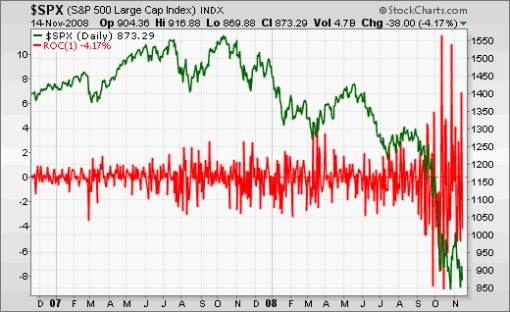
    But that doesn't tell the whole story. It was a month that witnessed the second worst week ever, as well as one of the best.  It had two days where the S&P 500 was up more than 10%; along with one of the market's worst ten days ever too.  To sum it all up, "Volatility" was the word of the month.

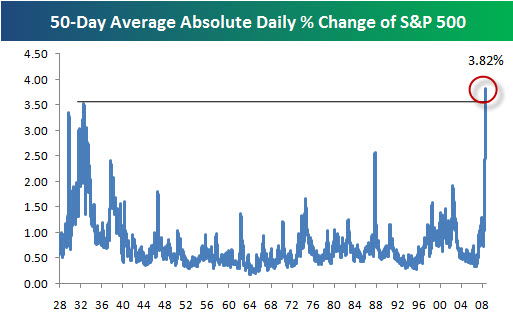
    In terms of daily moves, the S&P 500 had only three trading days in October where the one-day change was less than 1%. Looking back over the last 50 trading days, the average daily change in the S&P 500 has been a move of 3%.   Unfortunately for the bulls, most of those moves were down. Historically, the only period where the average daily move in the S&P 500 has been higher was during the Depression.

    The volatility affected traders significantly.  If you summed the intra-day zig-zags, the daily range has been much higher. This put many trading models into unseen territory.

    Barry Ritholtz put together a list showing just how bad October was.  I enjoyed it, and think it is worth the click; here is a link to that post on the Big Picture.

  • Market Commentary from October 24th, 2008

    It has been another strong week for fear, greed and volatility.  Earnings season is here, and we are seeing large moves in both directions.

    There continues to be unprecedented global cooperation in the wake of the financial crisis.  The world seems to understand that it has to "snooze" the alarms until after the US election. The French have asked for a series of global summits to deal with the global financial crisis, with the first to begin after the U.S. election — and the last and most important to be held after inauguration day.

    Stratfor claims that this shows two things. The first is how flexible many international crises are. They can wait for changes in political leadership. The second is how important the United States remains. If the United States had lost its leadership role, French President Nicolas Sarkozy would not have gone to Washington to get the Americans to agree to a summit. The rest of the world could proceed by itself. Most likely, that isn’t going to happen. The Europeans and Asians meeting by themselves would not be in a position to make any decisions. For that, the Americans need to be there. And since the Americans won’t have a new leader until February, the world financial crisis will just have to wait until then. My point?  It would be prudent to expect fear, greed and volatility to continue.

    Looking at this daily chart of markets for the past few weeks, I'm struck by this seeming randomness. It almost looks like there's no pattern.

    081022 ES Daily

    It is as if Jackson Pollock threw paint on our trading monitor and we mistook it for a chart. This utter lack of pattern might be an incredibly clear statement by the market. It says: "Danger, there is no edge here."

    The strange thing about markets, though, is that what doesn't make sense from one perspective – may make a lot of sense from another.  For example, here is a daily chart of the same S&P 500 Index, only showing a much longer window of time.

    081024 SPX Support and Resistance

    Hopefully that long-term support line (just below 800) holds.

  • Weekly Commentary through October 17th, 2008

    The markets gained some ground this week, at least from a point perspective. It's so tempting to want to believe that the worst is over because of some of the rallies we've seen since late last week.

    It is possible that last week marked a major bottom. However the market is certainly not trading normally. So I'm not convinced.  The volatility we're seeing is unprecedented.

    Just this past week we had days with 10% – 15% swings inside the day. In fact, over the past 10 days the Dow had intraday swings of almost 85% of its total point value. We also saw the largest single day loss in the
    S&P ever (9%) as well as one of the biggest gaining days ever. My point is simple, fear and greed are still operating in extreme levels.

    Stress Metaphor and the Markets:

    A lecturer, when explaining stress management to an audience, raised a glass of water and asked 'How heavy is this glass of water?' Answers called out ranged from 8 to 20 ounces. The lecturer replied, 'The absolute weight doesn't matter. It depends on how long you try to hold it.

    'If I hold it for a minute, that's not a problem.
    'If I hold it for an hour, I'll have an ache in my right arm.
    'If I hold it for a day, you'll have to call an ambulance.

    'In each case, it's the same weight; but the longer I hold it, the heavier it becomes.'

    He continued, 'And that's the way it is with stress management. If we carry our burdens all the time, sooner or later, as the burden becomes increasingly heavy, we won't be able to carry on.'

    'As with the glass of water, you have to put it down for a while and rest before holding it again. When we're refreshed, we can carry on with the burden.

    How does this apply to the stress and the volatility hanging over the heads of market participants? The potential recovery is in a fragile state simply because people are stressed and tired; and I don't think it won't take much to trigger another bout of fear and greed.

  • If We Have “Economic Allies”, Who are our “Economic Enemies”?

    Butterfly_blue2
    Have you noticed how correlated and coordinated actions have
    been worldwide throughout this crisis? The concept of economic allies
    presupposes that we also have economic enemies. It's easy to construct
    a theory that countries like Russia and China are using financial
    markets to exert leverage in a nascent form of economic warfare.

    It is
    also easy to construct a theory that says that we are the enemy
    ourselves. That human nature's fear and greed instincts and reflexes
    almost inevitably spiral into a cavalcade of horrors.

    The butterfly effect theorizes that a butterfly
    flapping its wings in Beijing on one day can create or affect a rainstorm over
    Chicago a few days later.

    Likewise in a world where there is so much global
    communication, and where automatic trading programs can respond to each other from anywhere on the globe, it's no wonder that market moves are
    getting bigger, faster, and more volatile.

    Perhaps governments are cooperating and collaborating because of a collective recognition that a new form of
    protection is needed to dampen the increasing speed, size and leverage behind
    market moves?