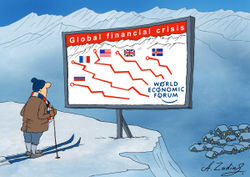
Trading

  • Capitalogix Commentary 01/09/09

    Economist Chart of Stock Market Returns shows 2008 as second worst year since 1825.

    This was the first full week of trading in 2009.  While the markets pulled-back a bit, most defended their technically-important 50-day moving averages.

    Two Steps Forward, One Step Back:  This week started with 80% of the S&P 500 stocks sitting above their 50-day moving averages.  That is stat-geek-speak for "there has been a significant rally off the November bottom." Moreover, people are feeling good about the market's progress. Investors Intelligence
    readings show people are more
    bullish now than they were during the rally off the July low.

    Regardless of my analysis or opinions, we rely on mechanical trading models to determine our market posture. Still, I follow the markets closely, and the market's consistently negative bias surprised me this past week.  That might be good though.  We worked-off a lot of the overbought condition and put things in place for a more natural Obama Inauguration Rally.

    How Bad Was 2008?  The chart on the right is from The Economist, and shows the distribution of US Stock Market Returns Since 1825.  One of the things it shows is that 2008 was the second-worst year of performance.

    So as awful as 2008's performance was, historically, remember that it ended with a 20% rally off the bottom to end the year. 

    The real question is whether you think the rally will last?  Is it a Bear-Market
    Rally sucker play, or a real opportunity to put some capital back to
    work?

    I predict big changes are coming (not hard to do with the economy where it is and a new President about to take office).  So, here are some data to help point the way.

    Here are a Few of the Posts I Found Interesting This Week:

    • Cover your eyes, then check-out these 2008 Year-End Returns for World Markets.(Bespoke)
    • US Unemployment Back to 1945 Levels; 2.6MM Jobs Lost in 2008. (Citywire)
    • Oxymoron? A relatively sane Elliott Wave market
      prediction for 2009. (Yelnick)
    • Bear Rally or Bull Market?  Are too many people too bullish too quickly? (Hulbert)
    • The Fed is Flooding the Markets with Cash. (Clusterstock)
    • WSJ's "The End of Wall Street" video series (Click to Watch)
    • The End of the Financial World As We Know It? (NYTimes Part 1 & Part 2)
    • Ironic that Satyam (which means Truth) didn't outsource Fraud, they did it themselves. (FT)

    And, a little bit extra:

    • Putting tongues firmly in cheeks, Porn Industry seeks $5BB Federal Bailout. (CNN)
    • Obama Fighting for his Blackberry.  This may be a fight he loses. (TechDirt)
    • Why do Investment Swindles continue to work? (WSJ)
    • Can Risk Be Adequately Quantified? (Naked Capitalism)
    • This year China's
      Internet users will surpass the entire population of the U.S. (Kedrosky)
    • The Bull and Bear Cases for Hedge Funds. (Bull: Seeking Alpha and Bear: Yahoo Finance)
    • Balanced Commentary on the Middle East's Hundred Year War (Economist)
    • Funny list of "Stuff White People Like" – and I do like most of it. (Blog)
  • WSJ’s “End of Wall Street” Videos

    Explains how easy money led to the collapse of Wall Street's biggest firms.

    Chapter One: What Happened? In the first of this three-part series, Journal reporters explain how the housing bubble inflated and burst, and why easy money led to the collapse of Wall Street’s biggest financial institutions.

    Direct link for Chapter One.

    Chapter Two: Why Did it Happen? What was going through the minds of CEOs, corporate boards, fund managers and mortgage lenders as they created hard-to-understand derivatives Warren Buffett once called ‘weapons of financial mass destruction’.

    Direct link for Chapter Two.

    Chapter Three: What Happens Next? This final chapter of the crisis on Wall Street tells the story of the $700-billion bailout, as seen through a reporter’s eyes, and looks at what’s ahead for the global economy.

    Direct link for Chapter Three.

  • Weekly Commentary through January 2nd, 2009

    Year-to-Date, the Dow is UP for the year. It has been a long time since you've heard that phrase.  There was no point in 2008 when the Dow was up for the year (at the close of a trading day).  According to Bespoke, since 1900, 2008 was only the fourth year where the Dow (1910, 1962, and 1977) never had a single day where it closed up for the year.  So, as of now, we officially suck less than last year.

    Last week the major market
    averages moved above their 50-day averages for the first time since late August.The Dow is over 9,000.

    The January Barometer:     

    Does a market rally in January imply anything for the rest of the trading year?  "As goes January, so goes the year." This particular phenomenon is what is referred to as the January Barometer.  

    090102 January BarometerIs it true?  I don't know; but it is fun to examine.

    Many reputable services report the January Barometer's recent-history success rate at around 75%; so it is worth watching.

    I was going through some research and found this chart from Chart of the Day.  It illustrates that the S&P 500 has performed much better (on average) during the months following a January gain.  The chart is a few years old, but recent years have followed this trend.

    John Murphy has a slightly different perspective; he says that what the market does during the first week of the new year often gives a clue about direction for the remainder of the year.

    Murphy cites the Stock Trader's Almanac, "S&P gains during January's first five trading days preceded full-year gains 86% of the time". The predictive ability of the month of January is nearly as impressive. "The January Barometer predicts the year's course with a .741 batting average. 12 of the last 14 post-election years followed January's direction" (Almanac).

    The market dropped during the first week and month of 2008 and correctly warned of a bad year ahead. We had a good start to that first week of January here in 2009.  Let's hope it keeps up.

    Here are a few of the posts I found interesting this week:

    And, a little bit extra:

    • Twitter users grew 6X last year, and 10X more is expected in 2009. (Financial Times)
    • The day Microsoft Zune stayed still; caused by a leap-year glitch. (NYTimes)
    • Apple OS market share tops 10% as MS drops (TUAW)
  • Capitalogix Weekly Commentary – December 26th, 2008

    This week I will keep the commentary light, just like the trading volume has been.  Also, I put together a list of posts that I found interesting. 

    Quantitative Easing:  Now that the Fed has effectively cut the target lending rate to zero, it only has one more weapon in its arsenal – Quantitative Easing. Here is an easily understood video explaining this.


    Quantitative easing from Marketplace on Vimeo.

    Here are a few of the posts I found interesting this week:

    • For stores, a very un-merry Christmas. (CNN)
    • Amazon had a happy holiday season. (BizJournals.com) and TechCrunch)
    • Turn-about is fair play; Russian Professor Predicts End of USA (WSJ)
    • Oil jumps above $39 as Israel-Gaza conflict widens. (Marketplace)
    • Out With the Old, because Creative Destruction made it obsolete. (Lindzon)

    And, a little bit extra:

    • Is this the next hot item?  Burger King Cologne Sold-Out. (Reuters)
    • Are computer operating systems becoming extinct? (InfoWorld)
    • Do you still read books?  Electronic Book Readers are getting more popular. (NYTimes)
    • This is Shaquille O'Neal; This is the Real Shaquille O'Neal on Twitter.  (NYTimes and Twitter)
    • Will Cow Flatulence Be Taxed to Combat Global Warming? (TheWeek)
    • Bronx Mowgli Wentz, a name for a rock star or senator? (Fox)
  • Capitalogix Commentary on the Markets 12/19/08

    The Federal Reserve decided to drop their target Fed Funds rate to an all-time record of 0.00% to 0.25%.

    This chart, from Bill Luby's Vix and More,  highlights the daily effective federal funds rate, which is a volume-weighted average of rates on trades arranged by major brokers.  It puts things in perspective, doesn't it?

    Fed Funds Effective Rates Since 1954

    Not surprisingly, last Friday’s effective Fed Funds rate of 0.11% is a record low.  In contrast, the record high of 22.36% dates back to July 22, 1981. The average Fed Funds rate since 1954 is 5.62%.

    People Are Less Scared.

    Something else going down is the VIX, which is now down more than 50% from its highs.  The VIX looks out 30 days into the future and captures “event volatility” associated with events that are expected to occur in the next 30 days. These include Fed meetings, important economic data releases (employment report, consumer prices, retail sales, durable goods orders, GDP, etc.), earnings from bellwether stocks, even hurricanes, geopolitical crises and other events which can expect to cast a shadow over the course of the next 30 days.

    081219 VIX Down 50 Percent

    As shown above, the VIX recently broke below its November lows and is currently resting just above 40.

    The VIX typically goes up when the market goes down, but even on days when the market has declined this week, the VIX has gone down as well.  That means investors are feeling a lot less fear.

    What about the Government, though?  If they are so confident, why continue to print money?

    What's a Few Trillion Among Friends?

    Since the economic-stimulus package in February, the government has offered more than a dozen multibillion-dollar rescue packages for a variety of industries endangered by the financial chaos and the recession. The magnitude of even one of these mega-bailouts is hard enough to grasp. The following Slate visualization attempts to put the magnitude of these rescue packages in perspective.

    081219 Slate's Interactive Bailout Guide

    Here are a few other items that caught my eye this week.

    • Is it a Bail-Out or Smart Economics? (Dash of Insight)
    • Sy Harding Argues that Government Responses Will Limit Recession. (Financial Sense)
    • Money flow up sharply as S&P holds 50-day Moving Average. (Fallond)
    • Biggest 6-Day Decline Ever for the Dollar. (Bespoke)