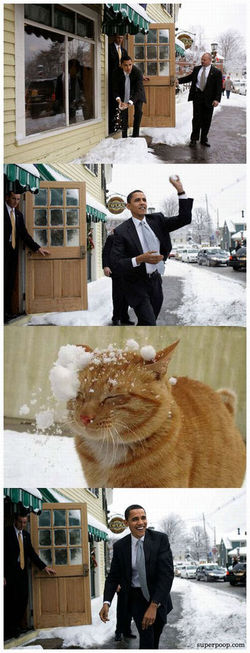
This series of photographs is interesting to me because it so clearly gives us the wrong impression. Deep down you know that your mind created a story about what it means; and, yet, you know it didn't happen.
Obviously I picked this series of photos to illustrate a point. Just because we perceive something, doesn't mean it's true.
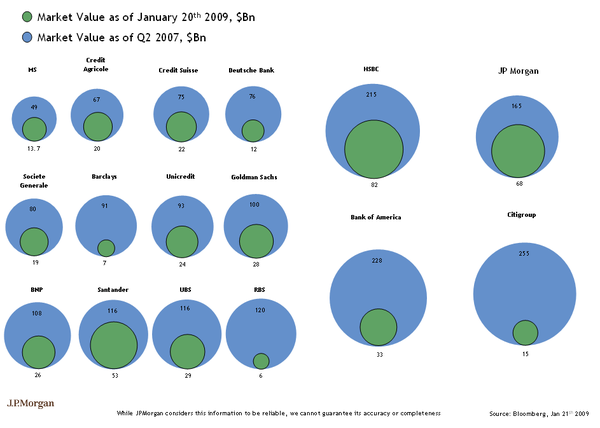
That point is even more true during emotionally trying times, when we're looking for confirmation of our worst fears. In this market environment, it's not hard to find data to scare you.
We don't just make things up, though, we also notice things and infer meaning from them. I suppose there was an evolutionary benefit to our ancestors who were able to infer danger before it ate them. Nowadays, it's probably better if we temper those instincts a little.
Why Do We See Patterns In Random Data?
The human mind is especially good at finding patterns in data.
Often, I believe that I see a pattern in random data. OK, I understand that I don't really see patterns in random data; but to me it seems to me like there are patterns in the random data.
This happens because we don't look at data neutrally. That means when the human eye scans a chart, not all data points get equal weight. Instead we tend to focus on outstanding cases, and we tend to form our opinions on the basis of these special cases.
In other words, it is human nature to pick up the stunning successes (or failures) of the method and to overlook the more common performances.
So, for example, when I am investigating a new pattern, I see many instances where that pattern works. And that is precisely the reason that we use a computer; because it will find every instance of the pattern and confirm how often it truly works, and whether it provides a reliable edge.
I suspect that the desire to find patterns is the same element of human nature that leads people to become superstitious, read their horoscope, or go to a fortuneteller. It is also the reason so many authors and speakers sell access to their chart patterns that supposedly work. The successes are much more startling than the failures. So the successes stand out.
The Last Time I Felt This Bearish:
Here is a picture of my S&P chart analysis from August 2003.

I was painfully bearish, and wrong. Yes there was a giant downtrend, and many of the technical trading chart patterns that I knew indicated that the market was likely to plunge yet again. But it didn't.
That points out a very interesting aspect of trading; every trade happens because of a disagreement. The buyer thinks prices likely to go up. The seller thinks it's likely go down. If that wasn't true, neither one would take their side of the trade.
The point is that it's important to see each trade from both sides of the fence. In order to remove some bias, learn to visualize the trade from the other perspective. Then you can re-evaluate and decide if you still want to take that trade.
The OOPs Trade: When a well-known pattern fails, the response is often dynamic. In fact there's a name for this, it's called an "OOPs Trade". This often happens with obvious, high profile, situations like a "Head-and-Shoulders" pattern, the break of long-standing Trend-Line, violation of a clear Price Channel, crossing the 200-Day Moving Average, at big Round Numbers (like Dow 10,000), or even at key Support and Resistance Levels (like these recent lows). The violent reversal happens when the crowd realizes that it was wrong and has to get out of the trade. This is very similar to a short squeeze; and the move is often violent and prolonged.
The markets are oversold here, lots of people know that we just made new lows, and we have been bombarded with bad news recently. So, I'm not predicting that the market will reverse here. I am just suggesting that it is possible. OOPs.