Trading

  • Capitalogix Commentary 3/13/09

    Cartoon Economic Rubik Cube
    It's a puzzle.  Is this yet another bear-market bounce, or the start of something more meaningful? It was just the second gain in 10 weeks; but the 12% rise from 12-year lows was enough to start the debate.

    The usually bearish, and quite well-respected, Doug Kass suggested that we might be seeing a "generational low" here.  Personally, I'm skeptical.  But when Doug Kass and Warren Buffet agree, I'm going to try and see what they see.

    Also note that tech is leading, and the financials are doing reasonably well, right now, too.  For a sustained rally, that is as it should be.  Nonetheless, the proof will be in the follow-through.

    With that in mind, here is a chart of the Banking Index from Bill Luby's VIX and More.  It shows that we've had one-week rallies several times since August.  A bigger move might be an important sign?

    090313 BKX One-Week Rallies

    Also note that the major US Equity Indices are rallying into the overhead resistance created by the November lows. And that is where we start the week.

    There's a joke amongst traders: The Trading Gods allow you to buy the low-tick then sell the high-tick … once. After that, you're free to do the opposite as often as you want.

    Note that there is a kernel of truth in most good humor … and if you haven't seen Jim Cramer on the Daily Show, it's worth watching.

    Here are a Few of the Business Posts Moving the Markets that I Found Interesting This Week:

    • Global Stimulus Coordinated Effort Shot Down. (The Daily Beast)
    • China’s Leader Says He Is ‘Worried’ Over U.S. Treasuries. (NYTimes)
    • Outsmarting Wall Street? How Quants Tried to Model The Physics of Money. (NYTimes)
    • AIG Paying $165 Million in Bonuses After Federal Bailout. (NYTimes)

    And, Here are a Few More Lighter Ideas and Fun Links:

    • What does one TRILLION dollars look like? (PageTutor)
    • The Unsaid Reason VCs May Not Back You: Resource Efficiency (Mark Peter Davis)
    • Time Management in the Age of Social Media. (BusinessWeek)
    • Twitter Has A Big Month, Grows To Over 8 Million U.S. Users (SocialTimes)
  • Capitalogix Commentary 03/06/09

    Cartoon Why This Depression is Worse than 1930

    You've probably heard the joke about the difference between a recession and a depression.  It's a recession when your neighbor loses their job; and it's a depression when you lose yours. 

    Here is a cartoon that pokes fun at something similar.

    The 1929 crash got off to a much faster start, but we have now more or less caught up.  That isn't as funny because of how true it is becoming.

    Bespoke had an interesting tidbit, only 5% of stocks in the S&P 500 are still trading above their 50-day moving averages.  Three sectors — financials, industrials, and utilities — have zero stocks trading above their 50-days.  Technology has the highest percentage of stocks above their 50-days at just 12%.

    Because of the unrelenting selling, many believe that stocks are ripe for a bounce. Supporting that are several reasonably reliable indicators.  The first is that Smart Money
    is continuing to get more bullish (while retail investors continue to get
    more bearish).  We are getting close to levels that often signify
    rallies.  Similarly the American Association of Individual Investors (AAII) reported the highest level of bearishness (over 70%) since they started measuring in 1987. This is often construed as a contrarian indicator, since the highest levels of bearishness often occur at market bottoms.  So at least now you can feel good that people feel bad.

    Sometimes the truth in humor tells the story better than other methods.  Here is a clip from Jon Stewart's Daily Show.  In it, he does what he does to CNBC.  It's pretty funny.


    Here are a Few of the Business Posts Moving the Markets that I Found Interesting This Week
    :

    • GE Shares Fall to 18-Year Lows. (WSJ)
    • Unemployment Rate surges to 8.1% – Worst since 1983. (Guardian)
    • Gates foundation sells-off $100 million of Buffett shares. (CNet)
    • Sentiment Overview for the Week. (Trader's Narrative)

    And, Here are a Few More Lighter Ideas and Fun Links:

    • How to Be an Angel Investor. (Paul Graham)
    • Brief book summary of Jim Collins' "Good to Great". Interesting. (Brevity Brief)
    • Is web-design becoming more blog-like because of Search? (Forbes)
    • Silly service translates and dumbs-down what you say. (Untelligencer)
  • Capitalogix Commentary 02/27/09

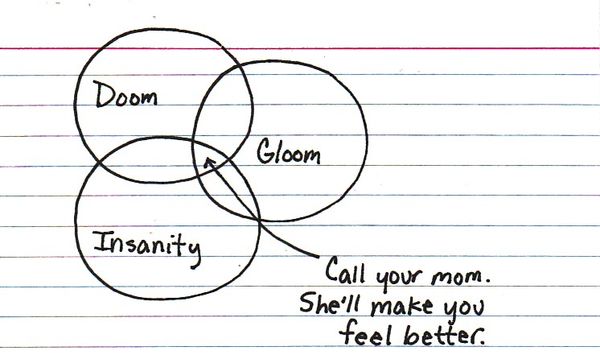
    This drawing made me smile, even though the market continued down.
    Intersection of Doom Gloom and Insanity

    Sentiment is bearish; not surprising since we're at market lows not seen in 12 years.  You know it's bad out there.  But to put it in perspective, Bespoke presents some sobering stats in "Ugly Stock Stats From an Ugly Bear."

    Adding to the market's concerns, here is a chart showing that Goldman Sachs slashed their S&P 500 Earnings Forecast.  They are expecting a peak-to-trough decline of 56% (behind only the Great Depression and WW1).

    GS Research on SP500 Earnings Decline
     

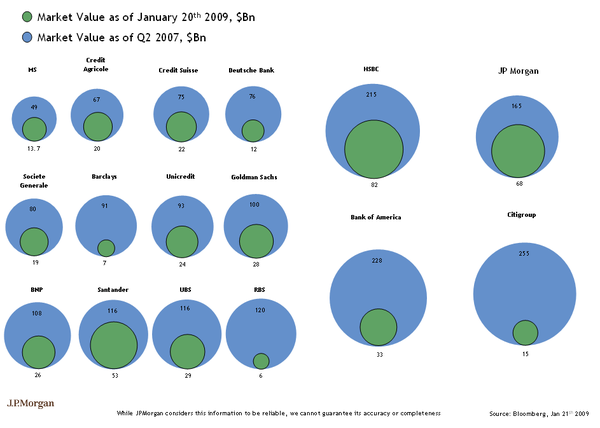
    And here is a chart showing the deterioration of major bank market caps since 2007. The Blue Bubbles show market value in Q2-07, while the Green Bubbles show recent values.

    Bank-circles

    (hat tip to Phil's Stock World)

    Regardless of the data, the real question is whether it will get better or worse from here?  

    Here is a positive sign. Smart Money is starting to get more bullish (while retail investors continue to get more bearish).  We are not yet at the levels that often signify rallies, but we are closer.  

    As we get closer to intermediate-term lows, I pay more attention to Sentiment measures. So I'll be keeping an eye on Trader's Narrative because they have lots of good content.

    I added a feature to the website this week.  A place where I link to the news that catches my eye.  I'll continue to post the best links here, and I'll have a bunch more for you on the blog.

    Here are a Few of the Business Posts I Found Interesting This Week:

    • VC's Top-Ten Reasons Start-Ups Fail. (Tim Draper)
    • What Warren Buffet Told His Shareholders? (CNBC)
    • PDF of Buffet's Berkshire Hathaway 2008 Annual Letter to Investors. (BH)
    • The Smart Growth Manifesto – It's Time to Reboot Capitalism. (Harvard Business)

    And, Here are a Few More Lighter Ideas and Fun Links:

    • A Nice Collection of Ancient Greek Wisdom and Quotes. (MSU)
    • Nation Instinctively Forms Breadline – Gallows Humor. (The Onion)
    • India Patenting Yoga Move to Protect Them from Western Pirates. (Neatorama)
    • A Site for Amazon Kindle Users. (Kindle Nation)
  • Capitalogix Commentary 02/20/09

    090220 Political Cartoon Will Hope for Work
    When America voted for Hope and Change – I don't think they expected to be hoping for a dollar and settling for two dimes, a nickel and a penny.

    Market Hits New Crisis Low:

    It has been ugly.  One sign that the Markets are having trouble is that Gold touched $1,000 for first time in a year.

    Another sign the markets are having trouble? The Dow Jones Industrial Average now has lost
    nearly half its value, breaking to a new six-year low.

    On one hand this seems to confirm people's fears that  stock
    declines aren't over, and dashes
    hope for a quick market recovery.  On the other hand, things don't bounce till they hit bottom.

    Will dry powder ignite the stock market? One bullish argument rests on the
    piles of cash sitting in bank accounts and money-market funds earning
    next to no interest.  As deal-maker's fingers get itchy and companies
    get more desperate for cash, many expect a flurry of deals.

    This Week's Chart:

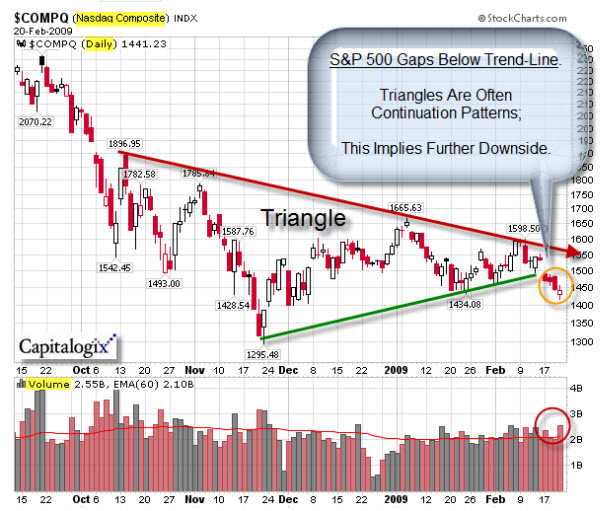
    Unlike the Dow, the S&P 500 has not made new lows.  It did, however, just break a clear trend-line.

    090220 SP500 Gaps Down Out of Triangle Pattern

    Most major US equity indices have been in a "Triangle" consolidation pattern (like the one shown in the chart above).

    You can think of the Triangle as a well-contested battle between the bulls and the
    bears.  Neither side has given-up much ground, yet.  Soon, though, one
    side will have had enough and the market will surge again. If it is a move up, then we get the relief rally people were looking for.  Even if you get a minor move down in the short-term, it can be constructive.  Here is why.

    The bear-swing down, from October through November, had a lot of
    momentum.  The consolidation worked-off a lot of that.  Consequently,
    another move down would result in many positive divergences – and would
    likely be strong support for the next rally.

    That doesn't mean the Bear Market would be over.  But an intermediate term rally would not surprise me here.  Especially as an OOPs trade.

    Here Are A Few Of The Business Posts I Found Interesting This Week:

    • Can This Be True? Federal Obligations Exceed GDP of Entire Planet. (WorldNet)
    • Pledge of $275 Billion to Cut Mortgage Payments & curb foreclosures. (Bloomberg)
    • Soros Sees No Bottom For World Financial Collapse, And Volcker Agrees. (Reuters)
    • Economists' Droopy Outlook for the US. (WSJ & Bloomberg)
    • Harvard Prof’s Plan for Saving the Financial System. (Creative Capital)
    • Is Starbucks a Leading Indicator of the Economy? (Inquirer)
    • Be Leery of Dow Theory – Does It Still Mean What It Used To? (Barrons)

    And, A Little Bit Extra:

    • Nature Versus Nurture: The Dynamics of Success. (TraderFeed)
    • Clever E-Cards For Many Occasions – Very Funny Stuff. (Someecards.com)
    • The Biology of Dating: Why Him, Why Her? (Time)
    • Psychologists' Worry: Medication May Erase Bad Memories. (MSNBC)
    • "Deliciously Gross" Heart-Attack Inducing Food. (This Is Why You're Fat)
    • Vintage Tobacco Ads; Apparently They'd Do Anything To Sell You Cigarettes. (Click)