Another grim report on unemployment casts doubt on the likelihood of a quick economic recovery.
The unemployment rate edged up to 9.5 percent in June, to its highest level in 26 years. The bigger problem is that many analysts expect joblessness to get worse in the coming months.
A Different Perspective on the Job Market:
Here is a chart that caught my eye on Barry Ritholtz's blog. It shows the increased competition for jobs. There are now close to six unemployed people for each available position.

The point is that as fewer jobs become available, it will get harder for normal citizens to obtain them. The cycle continues because loss of jobs means reduced spending … which means tighter margins.
So, this next chart doesn't surprise me. It shows that in addition to an increase in unemployment, there was also a decrease in hours worked. Simply counting the number of people who lost their jobs misses something important. Lots of people have lost part of their jobs through a variety of techniques like furloughs and thirty-hour work weeks.

Notice how consistent the decline in aggregate hours worked (purple line) has been over recent months. It is something to watch.
For a longer perspective, here is a chart comparing the monthly national unemployment rates since 1948. Click the chart to see the interactive version on WSJ.com.

Market Chart:
How will all that play-out in the Markets? So far, the markets have held-up nicely. I've been seeing more negative divergences and selling on down days … and less positive momentum and market breadth. But price is the primary indicator, and it has stayed above support.
Here is a daily chart of the Dow Jones Industrial Average Index. I marked a head and shoulders pattern that many traders are watching. Click the chart to see a full-size image.
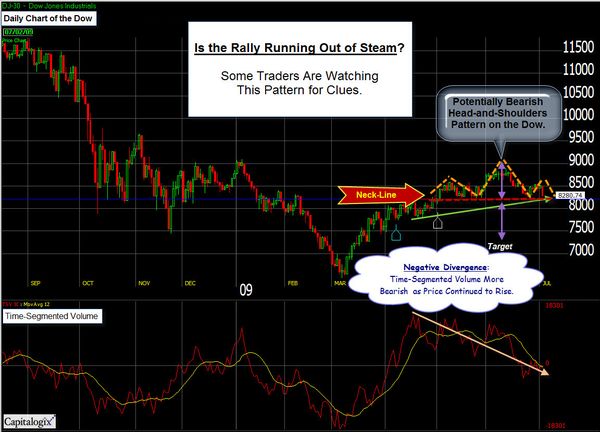
Short-term, a bounce still wouldn't surprise me. Nonetheless, a bigger correction seems likely.
Business Posts Moving the Markets that I Found Interesting This Week:
- Investors are Now Racing Toward Volatile Areas of the Market. (NYTimes)
- Another Indicator Predicts Economic Recovery is Near. What do you think? (MJPerry)
- A China Stock Bubble: IPO Mania Dangerous in Recession. (Time and Economist)
- Why China Hates the U.S. and What It Means for Your Portfolio. (Motley Fool)
- A Run on an Amish Bank Teaches the Risks of Modernity. (WSJ)
- The Fed's Delicate Balancing Act On the Complex & Slow Road to Recovery. (SmartMoney)
- How GE Reaped Bailout Dollars Even Though It Wasn't a Bank. (TDB)
- More Posts Moving the Markets.
Lighter Ideas and Fun Links that I Found Interesting This Week
- Michael Jackson Insider on What Really Killed Him. (TDB)
- Monkey 'Stock Market' Prone to Fluctuations Too. (NewScientist)
- Calculating Consumer Happiness at Any Price. (NYTimes)
- A Glimpse at the Future: Domestic Robots With A Taste For Flesh. (NewScientist)
- Scientists Create First Electronic Quantum Processor. (PhysOrg)
-
Tomato Pill's new form of Lycopene Beats Heart Disease. (BBC)
- Is an Ugly Baby Harder to Love? (Time)
- More Posts with Lighter Ideas and Fun Links.