Trading

  • Capitalogix Commentary for the Markets – 07/5/10

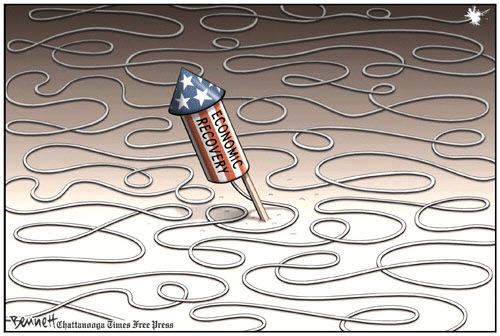
    It seems like there is a mighty long fuse on the real economic recovery.  We might be in for a longer wait than the recent rally led some to believe.

    100704 There is a Long Fuse on the Economic Recovery

    A record drop in pending home sales and a slowdown in the construction
    market contributed to a sluggish outlook for the economy last week, and highlighting the significance of government stimulus measures and job
    growth.

    Market Commentary

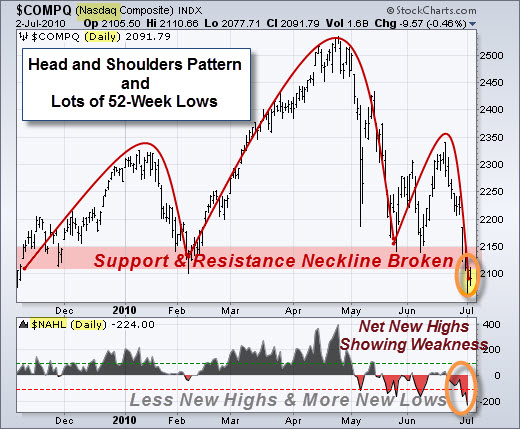
    The Nasdaq Composite Index is showing a well-formed Head and Shoulders topping pattern.  Price has broken beneath the neckline, which means it has triggered.  Unless it can move back above that level, the pattern's target is the distance from the top of the head (2500) to the neckline (2100), which is 400 points lower.

    Supporting the bearish case, new 52-week lows are expanding on the Nasdaq while new 52-week highs are drying up. Net New Highs (new 52-week highs less new 52-week lows) is an easy way to assess the battle for new 52-week extremes. An uptrend is unlikely as long as Net New Highs remain
    negative.
    100702 Nasdaq Head and Shoulders
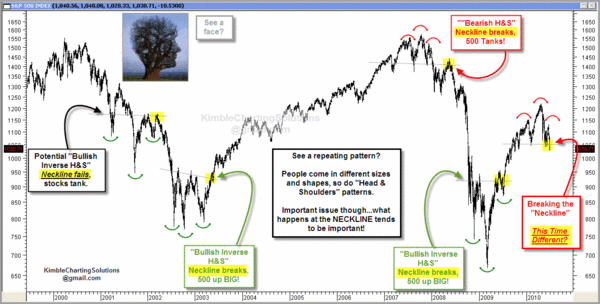
    Technical Analysis is often easy to see after the fact.  Here is a look at several Head and Shoulder top and bottom patterns.  Click the image to see a bigger version.
    100704 multiple necklines

    Here's Something That Will Show-Up On Lots of Radar Screens.

    On some level, Technical Analysis is a self-fulfilling prophecy because "everyone" is looking at the same thing.  While lots of people are worried about the Head and Shoulders pattern, I suspect that far more are watching the "Death Cross" or "Dark Cross" that is being formed on our indices as the 50-day moving average falls below the 200-day moving average.

    While I see the bearish implications, some trader's will be looking for the head-and-shoulders and death-cross patterns to fail because of a short squeeze.  Failed patterns often result in bigger moves than the patterns that didn't work.  Here is an explanation about why that happens.

    The OOPs Trade

    When a well-known pattern fails, the response is often dynamic. This often happens with obvious, high profile situations like a "Head-and-Shoulders"
    pattern, a move through big Round
    Numbers
    (like Dow 10,000), crossing
    the 200-Day Moving Average, or violating a clear Price Channel. Just for the record, several of those are in-play at this price level.

    An often violent reversal happens when the crowd realizes that it was wrong, and people rush to cover their painful losing positions.  As the price of the stock increases, more short sellers feel driven to
    cover their positions.  This is very similar to a short squeeze;
    and the move is often violent and prolonged.

    The markets are
    oversold here; lots of people know that we just made new lows, and we
    have been bombarded with bad news recently.  So, I'm not predicting that
    the market will reverse here. I am just suggesting that it is
    possible and something to watch.

    Business Posts Moving the
    Markets
    that I Found Interesting This Week
    :

    • Why the Year's First-Half Performance Says Little About the Second. (MarketWatch)
    • John Hussman: A Recession Warning. (InvestmentNews)
    • Summer Internships: Unpaid Positions Gaining Popularity At Small
      Firms. (LATimes)
    • Apple iPad Sales Hit Three Million in 80 Days. (WSJ)
    • Cost of Fannie Mae & Freddie Mac Rising; May Exceed Banking
      Rescue. (NYTimes)
    • More Posts
      Moving the Markets
      .

    Lighter Ideas and
    Fun Links

    that I Found Interesting This Week

    Enhanced by Zemanta
  • Capitalogix Commentary for the Markets – 06/28/10

    The deficit, the war, and the oil spill are still in the news.  While this cartoon jokes about how America achieves greatness, I suspect it is a topic that will get more attention.

    100627 America is Still Great
    The Fed left rates unchanged, citing overseas threats and "developments abroad." Do you see that as a sign that cooperation is waning?  Likewise, despite seeking further stimulus at the G20 Meetings this week in Toronto, the US found that world leaders were more concerned with trimming deficits.

    Meanwhile, US Treasury Secretary Timothy Geithner told the BBC that the US can 'no longer drive global growth'; and the world
    "cannot depend as much on the US as it did in the past". Instead, he said that other major economies would have to grow more for the global economy to prosper.

    With that in mind, there are three big bearish macroeconomic stories hanging over the market:

    • The sovereign debt issue in Europe.
    • The slowing Chinese economy.
    • The second leg down in housing.

    The big question is – to what extent is the bad news already priced-in to the market?

    Let's Look at the Charts.

    100627 Bearish EngulfingThe markets moved lower, as the economic news from housing
    to retail sales to revised Q1 GDP continues to confirm the weakness.

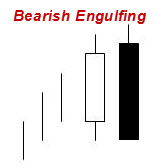
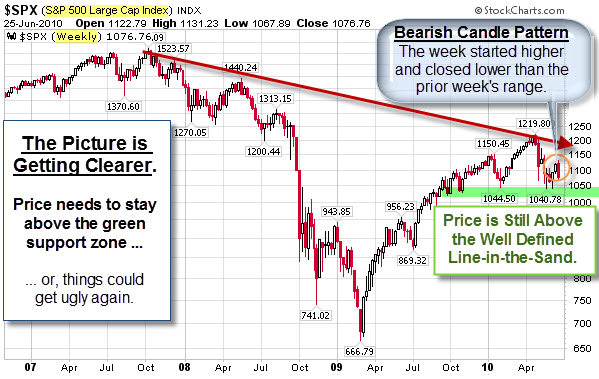
    The weekly chart of the S&P 500 Index shows that we are still beneath the down-trend that started in late 2007.  While price has held above the 1040 support zone (marked by the green highlight), last week's pattern (marked by the orange circle) is considered bearish.  The week started higher, yet closed lower, than the prior week's range (this is called a Bearish Engulfing Pattern); and often signals a trend change.

    100627 SP500 Picture Getting Clearer

    However, short term oscillators are getting more oversold. As a result, there are probably lots of people looking for an oversold rally next week.

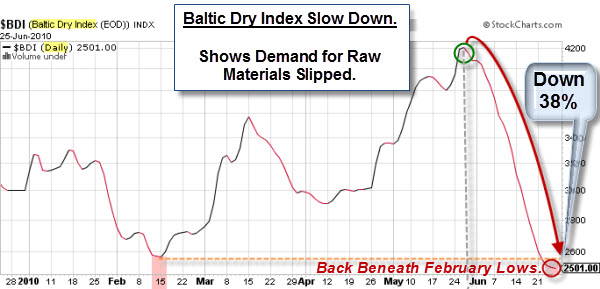
    A Leading Indicator of Economic Activity is Dying-Up.

    If you are looking for insight into global
    supply and demand trends, the Baltic Dry
    Index
    is one of the purest leading indicators of economic activity. It
    offers a real-time glimpse at global raw material and
    infrastructure demand,
    as well as the supply of ships available to move this type of cargo.

    Since making a short-term peak in late May (about a month after equity
    markets peaked), the index has declined 38%, and
    has just dropped below its February lows.

    100626 Baltic Dry Index Demand Slips

    Business Posts Moving the
    Markets
    that I Found Interesting This Week
    :

    • The Caution of the Fed Comes With a Risk.  Will It Spur Growth? (NYTimes)
    • Overview of the Gangs Shaping Economic Policy and Dialog. (ReformedBroker)
    • New-Home Sales Plummet 18.3% in May – A Record Low. (LATimes)
    • Legendary Trader Victor Niederhoffer on Being Wrong. (Leavitt
      Brothers
      )
    • Cold War Over: Russia Drops Capital Gains Tax to Attract Investment.
      (BBC)
    • More Posts
      Moving the Markets
      .

    Lighter Ideas and
    Fun Links

    that I Found Interesting This Week

    Enhanced by Zemanta
  • Capitalogix Commentary for the Markets – 06/21/10

    100619 Weak IPOsInitial Public Offerings are an indicator of market health.  We got an interesting look through the IPO window last week, with six offerings.

    While some were weak, the long-awaited stock market debut of the Chicago Board Options
    Exchange
    had a strong opening reception.

    In general, though, it has been a tough market for IPOs. However, the WSJ argues that this has more to do with fundamentals of the deals than a weak market.

    So, how is the market doing?

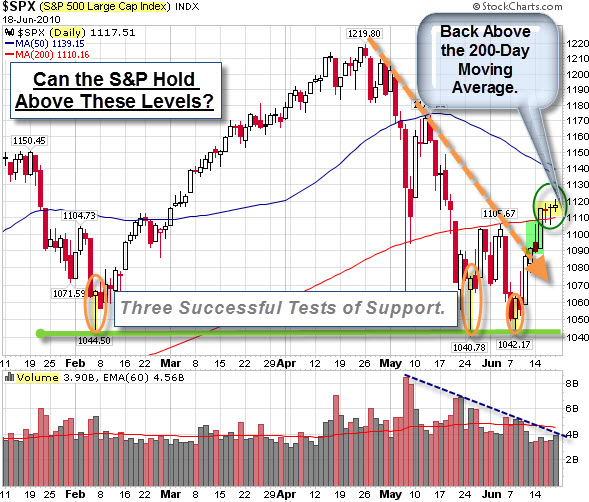
    Fighting the 200-Day Moving Average.

    Even people who are not big fans of technical analysis tend to look at the market's 200-day moving average. This is the simply the average of the closes for the previous 200 days. The 200 DMA has a decent track record — when the market is above the 200 DMA, it tends to rally, below it, not so much.

    In the daily chart of the S&P 500 Index, below, the 200 DMA is drawn as a red line.  The recent trades, back above the 200 DMA line, are circled in green with a yellow highlight.

    100619 SP500 Sitting Above Key Levels

    In the past few weks, the S&P 500 has tried to break out above its 200 DMA several times, but each attempt has sputtered out.  Let's see if it holds this time?

    There are a few other bullish reasons for it to hold.  The market has stayed above the light green 1040 support level, despite three tests (marked by the orange circles).  The last two tests count as a double-bottom, which indicates a bullish reversal (especially with price back above the orange-dashed down-trend line and 200 DMA).

    Sentiment towards the U.S. Markets is also getting better.

    The Pendulum Swings: Investors Starting to Pick U.S. Over BRICs.

    Bloomberg reports that the U.S. has supplanted China and Brazil as the most attractive market for investors as confidence in the global economic recovery wanes in the wake of the Greek debt crisis. 

    Almost four of 10 respondents picked the U.S. as the market presenting the best opportunities in the year ahead. That’s more than double the portion who said so last October.

    1006 US Ranked as Best Investment Prospect

    Business Posts Moving the
    Markets
    that I Found Interesting This Week
    :

    • Six Giant Banks Made $51 Billion Last Year; The Other 980 Lost
      Money. (Forbes)
    • Apple Reports 600,000 Orders for New iPhone On First Day. (NYTimes)
    • The Pain in Spain: On the Brink of Seeking Support From The
      Euro-Zone & IMF. (WSJ)
    • Trading Is Approved for Film Futures Contracts. (NYTimes)
    • State Crash Crunch: Arizona Sells Supreme Court Building for 3
      Month's Relief. (GEA)
    • More Posts
      Moving the Markets
      .

    Lighter Ideas and
    Fun Links

    that I Found Interesting This Week

    • I.B.M.'s Watson Supercomputer – Artificial Intelligence Smarter Than
      You Think. (NYTimes)
    • Interactive Map Shows Where Americans Are Moving.  Hint: Not to
      Detroit. (Forbes)
    • Obama's West Point Speech – Parsing the New Security Strategy. (Atlantic)
    • Things People Google When They Think Nobody Is Looking. Funny. (SEOLOL)
    • U.S. Identifies Vast Riches of Minerals in Afghanistan. (NYTimes)
    • More
      Posts with Lighter Ideas and Fun Links
      .
    Enhanced by Zemanta
  • Revealing Interview of Mike Novogratz, President of Fortress Investment Group

    100117-Howard-Getson-and-Mike Novogratz Mike Novogratz is the President of Fortress Investment Group, the first U.S.-based private equity/hedge fund manager to sell shares to the public. He joined Fortress in March 2002, and is responsible for the liquid hedge fund business, which includes running the Global Macro Funds.

    When we met earlier this year, I was impressed by his openness and perspective on the industry.  It also comes through in the interview below.

    In this revealing three-part interview, Novogratz shares his insights and reflections about:

    1.  How he earned his position.

    2.  The DNA, Risk Management, and Rules of Success in Macro Trading.

    3. The significance of Instinct, Luck, Intuition, and a "Real Intelligence".

    Mike Novogratz, President of Fortress Investment Group — Opalesque TVPart 1.

    Mike Novogratz, President of Fortress Investment Group — Opalesque TV Part 2.

    Mike Novogratz, President of Fortress Investment Group — Opalesque TV Part 3.

    Prior to joining Fortress, Novogratz spent 11 years at Goldman Sachs,
    where he became a partner in 1998. He held the positions of president of
    Goldman Sachs Latin America and Head of Fixed Income, Currencies and
    Commodities Risk in Asia, where he lived from 1992 to 1999. Mr.
    Novogratz received a B.A. from Princeton University, and served as a
    helicopter pilot in the U.S. Army.

    Fortress Investment Group
    (NYSE: FIG) is a leading global
    investment management firm. Total assets are around $41.6bn, with
    $4.3bln in a global macro and a commodities based hedge fund.

    Enhanced by Zemanta
  • Capitalogix Commentary for the Week of 06/14/10

    The fear, right now, is whether the recent down-turn will continue.  Meanwhile, there are signs of strength giving hope to the bulls.

    For example, disappointing U.S. retail sales data, last Friday, failed to dent the stock market as it closed higher on the day and the week.  That marks the first weekly gain in nearly a month. 

    Last week's market action sets-up some pretty clear decision-zones to watch.

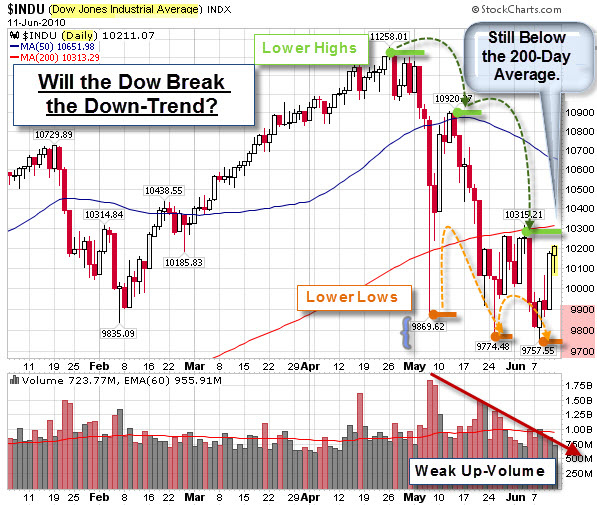
    First, Let's Look at the Dow.

    Despite the recent market correction and fears surrounding Eurozone sovereign debt defaults, the bottom line is that the Dow Jones Industrial Average is only down 10% from its recent peak.  That is not bad, especially considering the length of the preceding rally.

    However, a quick look at the chart shows a series of lower highs and lower lows.  This is the classic definition of a down-trend.  Two other bearish things to notice are that price is still under its 200-Day Moving Average and that volume has been weaker on the recent up days.

    100613 Dow Jones Down-Trend
    On a bullish note, the Dow spent a good day-and-a-half below the 9,900 level, yet, sellers did not appear in force … and buyers once again prevailed. Analysts are likely to see a sustained break above the 10,300 level as a bullish sign.

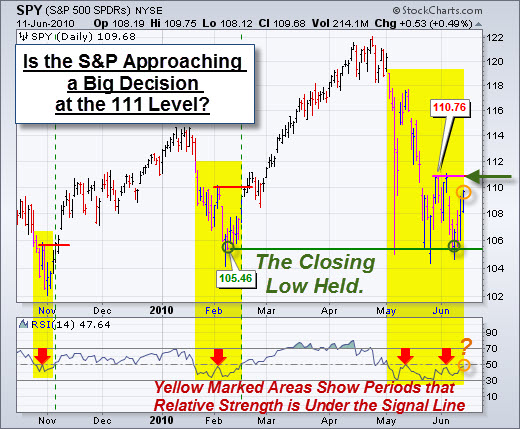
    RSI Indicates That We Are Still in Bearish Territory for the S&P 500, as well.

    A chart of the S&P 500 ETF indicates that we may have some upside left in the recent bounce.  While the Relative Strength Index indicator remains bearish below its center-line for the SPY, it is close to turning positive.

    According to Arthur Hill at StockCharts.com, bounded momentum oscillators trade within a defined range. RSI trades between zero and one hundred, with fifty as the center-line. Think of this level as the 50 yard line in a football game. The bulls (offense) have the edge when RSI is above 50. The bears (defense) have the edge as long as RSI is below 50.

    In the chart, below, the yellow areas show periods with RSI below 50, which correspond with declines. RSI met resistance near 50 during each decline (red arrows). In fact, RSI met resistance near 50 twice during the current decline, and it is at that level again.

    100613 SPY Relative Strength

    So, while momentum remains bearish as long as RSI is below 50, this
    chart
    shows we are approaching a decision point.

    What Does the Extreme Fear Shown by Option Purchasers Mean for the Market?

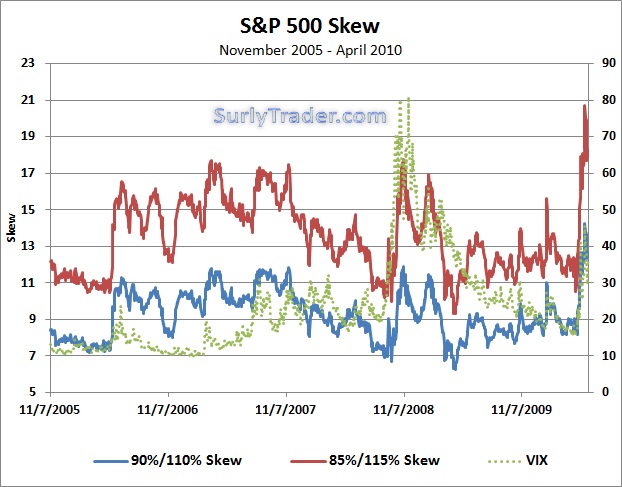
    The public often uses the VIX as the standard measure of “fear” in the overall market.  Some prefer to look at option skew instead.  Skew tells the investor how much out-of-the money puts are being bid up versus out-of-the money calls. 

    If an investor is scared about the downside, then they buys puts.  If an investor thinks there is room for upside, then they are willing to buy calls.  SurlyTrader posits that when the difference between the implied volatility of OTM puts dwarves OTM calls, then investors are fleeing for the exits.  As the chart below shows, on May 20, 2010, the skew of 3-month options hit a five-year-high.

    100613 SPX_Skew

    Depending upon valuations and underlying market conditions, the skew can signal either prescient fear or undue panic.  Consequently, if the spike on May 20th is a positive signal, then we should soon find our own local bottom.

    SurlyTrader advises: "If you believe we are close to a bottom, selling OTM puts and buying OTM calls looks very attractive with a steep skew.  Always think about selling insurance when the building is on fire rather than buying insurance after the major damage has already taken place."

    Business Posts Moving the
    Markets
    that I Found Interesting This Week
    :

    • CEOs Made 11% Less in 2009; But Are Riches Ahead Because of Cheap
      Options? (LATimes)
    • Metal Mania Hits Mining Equipment – Many Models Sold Out Until Next
      Year. (Money)
    • Why is Europe Responding So Timidly to Its Economic Crisis? (Slate)
    • Germany's 'Desperate' Short Ban Triggers Capital Flight. (Telegraph)
    • Inflation in the U.S. Slides to its Lowest Level in 44 years. (WSJ)
    • More Posts
      Moving the Markets
      .

    Lighter Ideas and
    Fun Links

    that I Found Interesting This Week

    Enhanced by Zemanta