The Fed had their annual meeting in Jackson Hole, Wyoming last week. On Friday Fed Chairman Bernanke announced that the Fed was ready to dig deeper and take bold actions if the economy continued to weaken. On cue, Intel announced lowered guidance and the Dow Jones Industrial Average was trading under its 10,000 level.

However, traders say that it's not the news that matters, but rather it's the reaction to the news that matters. In case you didn't see it, the reaction was consistent buying for the rest of the day. Not only did the Dow get back above 10,000, but the markets also erased much of their losses for the week.
Market Charts.
Here is a daily chart of the Russell 2000 Small-Cap Index showing the downtrend it has been in since April. The good news is that support held at the July lows. That level is marked by the green highlight. Any move beneath that would be decidedly bearish. On the other hand, it is unlikely the Bulls would feel safe until price clears the resistance level marked by the pink highlight.

Another thing to note in this chart is how dramatically the Russell 2000 Small-Cap Index had under-performed the broader S&P 500 Index since May. It is usually a bearish sign for the market when small caps and technology stocks are under-performing — which is what they are doing presently.
What is Happening with the Volatility Index?
While the markets retreated back near July lows, the Volatility Index (or VIX) did not show a spike of fear. Many traders view the VIX as a contrary indicator, which means the lack of fear could be bearish.

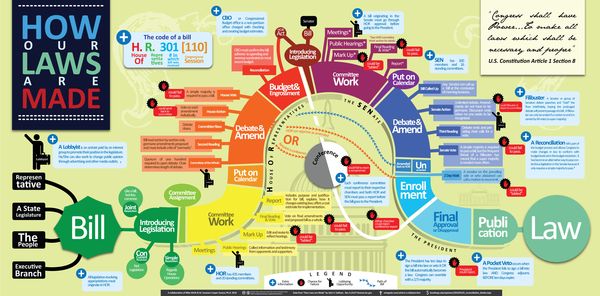
How Has the Government Spent the Stimulus So Far?
Counting through the beginning of August, Congress has now approved over $1 trillion in spending and tax measures to stimulate the economy. Here is a chart, put together by the Washington Post, which breaks down the spending.

I wonder what that will look like next year?
Business Posts Moving the Markets that I Found Interesting This Week:
- Bear Market Math – Are the July Lows in Danger? (YFinance)
- Does M&A Activity Predict Broad Stock Market Performance or Just Bank Profits? (SmartMoney)
- Amazon Web Services About to Be a Billion Dollar Business On Its Own. (BusinessInsider)
- Commitment or Folly: Microsoft's Online Efforts Lost $6 Billion in 8 Years. (ZDNet)
- Is China's Economy Worse than it Seems? (Stratfor)
Lighter Ideas and Fun Links that I Found Interesting This Week
- How Sitting on the Toilet Messes With Your Health. (Slate)
- The End of Management – Why Managers Should Act Like VCs. (WSJ)
- Kids Text Every 10 Minutes When They're Awake – What About the Rest of Us? (BusinessInsider)
- Google Adds Calls to Gmail – Big Warning Bells for Land-Lines and Skype. (WSJ)
- China Has a Massive Traffic Jam Could Last For Weeks. (AsianCorrespondent)