Trading

  • Capitalogix Commentary for the Week of 09/06/10

    The "invisible hand" is becoming replaced with a much more easily seen and felt version, and I suspect people are not only noticing … but adjusting.

    100904 Sheep-notices-man-and-dog-working-together

    At this point, I'm not sure if people (or the "market") want more or less intervention.  For example, The Financial Times reports that the Fed minutes released last week fueled recovery fears because the meeting notes raise questions about whether the Fed has ruled out large-scale asset purchases. (FT)

    Apparently, the powers-that-be still have some things in their bag-of-tricks.  Early last week I posted a Tweet saying that big market drops on low volume have been the trigger for Plunge Protection activity.  Not to disappoint, we got the requisite ramp-up.  The question is whether we'll get real follow-on buying?

    Market Commentary.

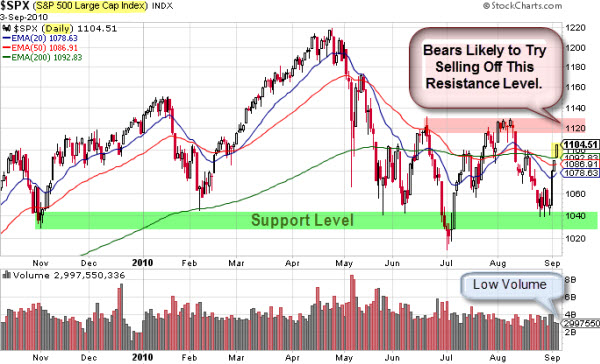
    Last week was technically stronger than I originally thought.  Why?  Because both the S&P 500 and Nasdaq indices moved above their 20-, 50- and 200-day exponential moving averages. That isn't a common technical happening. Getting through a single moving average often proves difficult; so getting through all three major moving averages at once is something worth noting.  Now let's see the reaction.

    100905 SP500 Decision Zone Levels

    The short-term average is below the mid-term average, which is still below the long-term average.  In English, that means we are probably still in a down-trend.  Consequently, I'll be watching the resistance zone market by the pink highlight. If bears mount a challenge to the recent push higher, that would be a likely spot for the reversal.  Otherwise, a break above that level could easily test the May highs.

    How Does Employment Effect the Outlook?

    It is a little ironic to talk about this on Labor Day weekend; nonetheless, we got more bad employment data last week.  The best I can say about it is that it wasn't met with selling. 

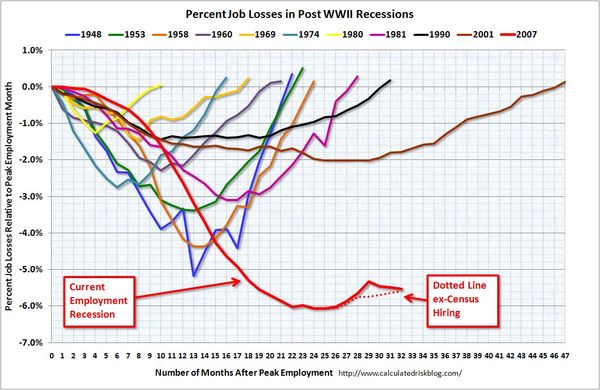
    First, we'll look at the percent of job losses during various recession.  The following chart shows that our current job situation stands out and speaks for itself.  This chart also highlights the effects of census hiring as well as the extremely weak hiring in this recovery. 

    The dotted lines tell the real story about how pathetic the jobs recovery has been so far. Bear in mind it has taken $$ Trillions in stimulus to produce this.
    100905 Employment Recessions
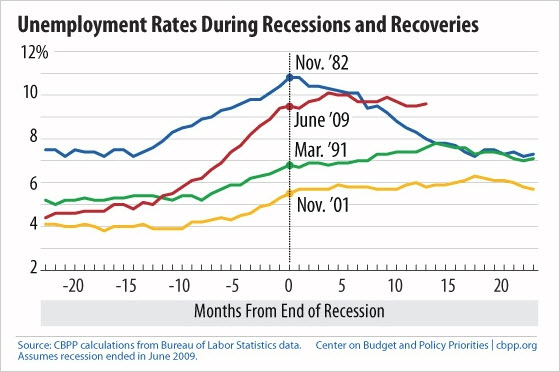
    Second, the chart below shows the unemployment rates during recessions and recoveries.  Notice that there has not been any recovery in the labor market.  Unemployment has actually deteriorated when compared to the end of past recessions.  

    100905 Unemployment Rates During Recessions and Recoveries

    According to the Pragmatic Capitalist, without a recovery in the labor markets, it’s impossible to say that the economy is rebounding.  As of now, the outlook remains negative.

    However, without sellers, that increasingly visible hand can continue to push the markets higher.  As summer (and slow trading) comes to an end, it will be interesting to see what happens next.

    Business Posts Moving the Markets that I Found Interesting This Week:

    • Another Example of How Nouriel Roubini Earned His "Dr. Doom" Title. (Atlantic)
    • The Rise of the PermaBears In the Face of Recessions & Ballooning Debts. (NYTimes)
    • Sign of the Times: Foreclosures of Million-Dollar-Plus Luxury Homes Rising. (LATimes)
    • Why Wall Street Is Deserting Obama. (Dealbook)
    • China’s Central Bank Chief Rumored To Have Defected (Forbes)
    • More Posts Moving the Markets

    Lighter Ideas and Fun Links that I Found Interesting This Week

    Enhanced by Zemanta

  • Capitalogix Commentary for the Week of 08/30/10

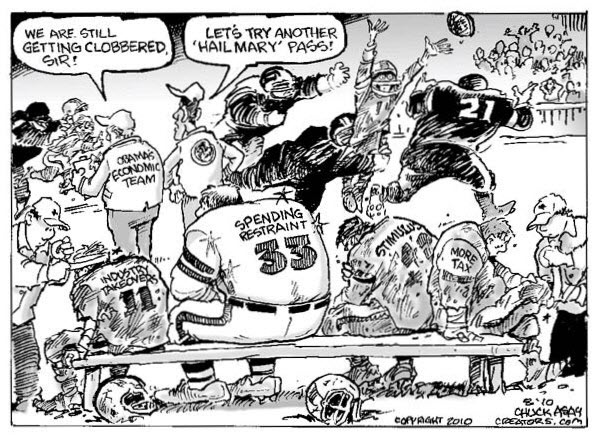
    The Fed had their annual meeting in Jackson Hole, Wyoming last week. On Friday Fed Chairman Bernanke announced that the Fed was ready to dig deeper and take bold actions if the economy continued to weaken. On cue, Intel announced lowered guidance and the Dow Jones Industrial Average was trading under its 10,000 level.

    100829 Hail Mary Time for the Economic Team
    However, traders say that it's not the news that matters, but rather it's the reaction to the news that matters. In case you didn't see it, the reaction was consistent buying for the rest of the day. Not only did the Dow get back above 10,000, but the markets also erased much of their losses for the week.

    Market Charts.

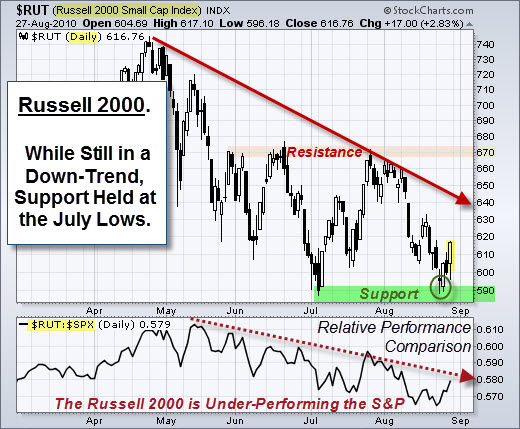
    Here is a daily chart of the Russell 2000 Small-Cap Index showing the downtrend it has been in since April. The good news is that support held at the July lows. That level is marked by the green highlight. Any move beneath that would be decidedly bearish. On the other hand, it is unlikely the Bulls would feel safe until price clears the resistance level marked by the pink highlight.

    100828 Russell 2000 Decision Levels
    Another thing to note in this chart is how dramatically the Russell 2000 Small-Cap Index had under-performed the broader S&P 500 Index since May.  It is usually a bearish sign for the market when small caps and technology stocks are under-performing — which is what they are doing presently.

    What is Happening with the Volatility Index?

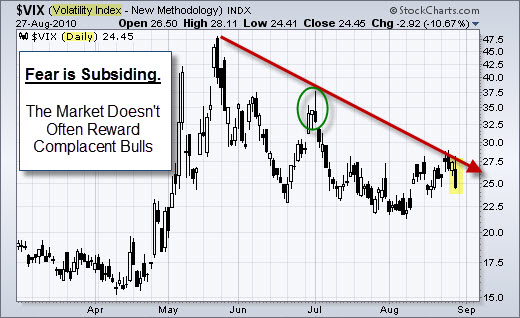
    While the markets retreated back near July lows, the Volatility Index (or VIX) did not show a spike of fear.  Many traders view the VIX as a contrary indicator, which means the lack of fear could be bearish.

    100829 VIX Showing Fear Subsiding

    How Has the Government Spent the Stimulus So Far?

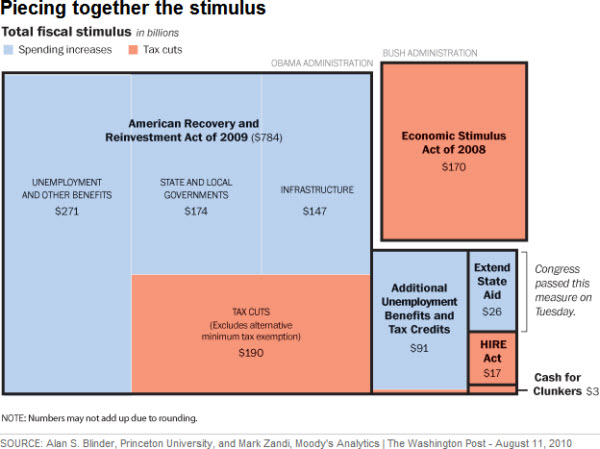
    Counting through the beginning of August, Congress has now approved over $1 trillion in spending and tax measures to stimulate the economy.  Here is a chart, put together by the Washington Post, which breaks down the spending.

    100829 Piecing Together the Stimulus So Far

    I wonder what that will look like next year?

    Business Posts Moving the Markets that I Found Interesting This Week:

    • Bear Market Math – Are the July Lows in Danger? (YFinance)
    • Does M&A Activity Predict Broad Stock Market Performance or Just Bank Profits? (SmartMoney)
    • Amazon Web Services About to Be a Billion Dollar Business On Its Own. (BusinessInsider)
    • Commitment or Folly: Microsoft's Online Efforts Lost $6 Billion in 8 Years. (ZDNet)
    • Is China's Economy Worse than it Seems? (Stratfor)

    Lighter Ideas and Fun Links that I Found Interesting This Week

    • How Sitting on the Toilet Messes With Your Health. (Slate)
    • The End of Management – Why Managers Should Act Like VCs. (WSJ)
    • Kids Text Every 10 Minutes When They're Awake – What About the Rest of Us? (BusinessInsider)
    • Google Adds Calls to Gmail – Big Warning Bells for Land-Lines and Skype. (WSJ)
    • China Has a Massive Traffic Jam Could Last For Weeks. (AsianCorrespondent)
    Enhanced by Zemanta

  • Capitalogix Commentary for the Week of 08/23/10

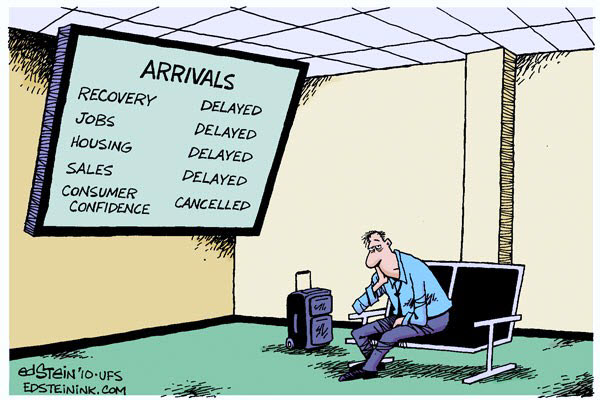
    We are in the dog-days of summer.  Perhaps it is a good time to travel, just so you are not tempted to watch the news.

    100821 Recovery Status Cartoon - Stein

    Biggest Negative Fund Flow Out of U.S. Stocks Since During the Crisis.

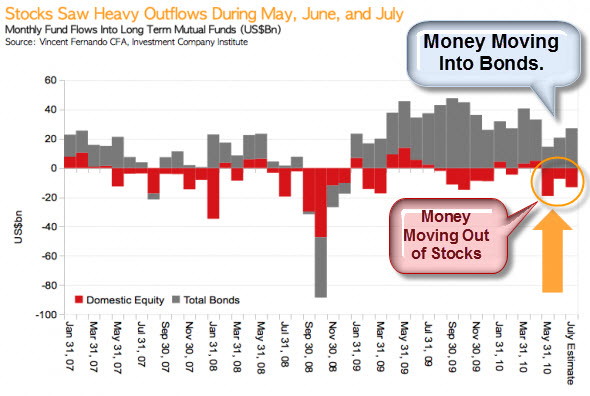
    Money is flowing out of equity markets into the bond market.  According to the NYTimes, investors withdrew a staggering $33.12 billion from domestic stock market mutual funds so far this year.

    In the chart, below, the red bars represent fund flows for U.S. equity mutual funds, and the gray bars represent fund flows for bond mutual fund.  The data for this chart is based on the fund flow data of long term mutual funds tracked by the Investment Company Institute.

    100822 Money Moving Out of Stocks and Into Bonds

    Likewise, according to Rasmussen research, consumer & investor confidence has fallen to a 2010 low.

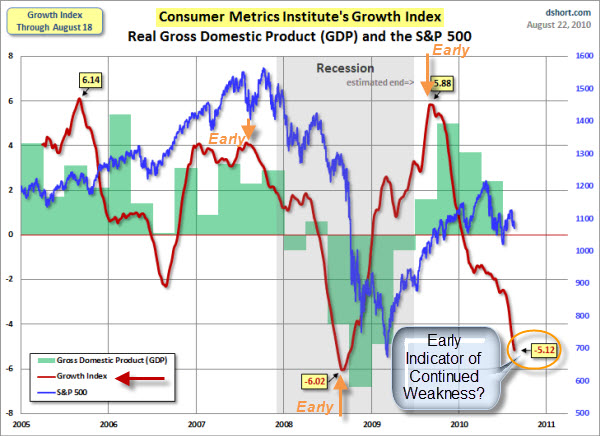
    The Consumer Metrics Institute's Growth Index.

    It's easy to get distracted by other data, but (for the most part) price is the primary indicator to use when analyzing a stock chart. Of course, it's still useful to try and get an early indicator of how a well-followed metric may perform.

    The chart below shows three different data points. The S&P 500 index, GDP, and the Consumer Metrics Institute's Growth Index.  Historically, the Growth Index has given an early indication of what GDP and the stock market are likely to do soon after. So, its recent decline might be an early indicator of continued weakness.

    100822 Consumer Metrics Growth Index
    This is something that bears watching.  If you're interested, here's a link from dshort.com that covers this topic in more detail.

    As more people worry that our economy is not changing as hoped; some things are changing … technology and legislation.

    How Does Technology Change the Investment Landscape?

    Duncan Niederauer, NYSE Euronext CEO, sat down with Maria Bartiromo at the "Techonomy Conference" in Lake Tahoe to talk about technological advancements and what they mean for the future of trading.


    My guess is that we are going to see a whole new round of cries for regulation of financial technology.

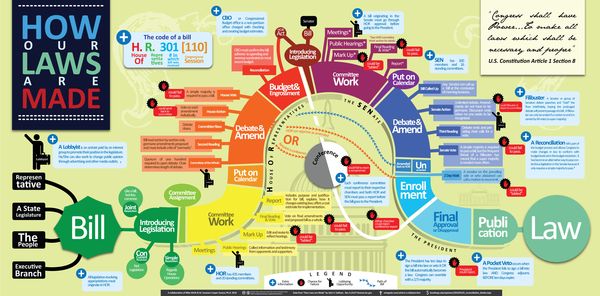
    Here is an Explanation of How Laws Are Made.

    For the past two years, Financial Reform has been in the news.  Here is is a link to a discussion of what it can accomplish. Now that the Dodd-Frank Bill has become law, I thought it might be helpful to show the path it had to take?  Here is an informative infographic put together by  Mike Wirth that lays out how a Bill becomes a Law.  Click the image to see a larger version.

    HowlawsmadeWIRTH2

    Business Posts Moving the Markets that I Found Interesting This Week:

    • Market Data Firm Spots the Tracks of Bizarre Robot Traders. (Atlantic)
    • Will the New Financial Reform Law Affect Big Bank Profits? (RollingStone)
    • Soros Flees Stocks, Yet Remains Bullish On 'The Ultimate Bubble' in Gold. (BI)
    • Rising Profits Are Good, But Sales Haven't Kept Pace. (NYTimes)
    • More M&A: Why Did Intel's Pay $7.68 Billion to Purchase of McAfee? (Newser)
    • Following Jobs Report, Consumer & Investor Confidence Falls to 2010 Low.
    • More Posts Moving the Markets.

    Lighter Ideas and Fun Links that I Found Interesting This Week:

    • Surprising Research on the Effect of Interruptions on Your Work. (BothSides)
    • 10 Amazing James Bond Gadgets That You Can Actually Buy. (BusinessInsider)
    • Big Brother is Watching: Judges Divided Over Growing GPS Surveillance. (NYTimes)
    • At Least It Wasn't Cancer: Doctors Find Pea Growing In Man's Lung. (NPR)
    • Class of 2014 Doesn't Know Cursive: Snapshot of a Generation. (Newser)
    • More Posts with Lighter Ideas and Fun Links.
    Enhanced by Zemanta

  • Capitalogix Commentary for the Week of 08/16/10

    Tracking the Hindenburg Omen: How Much Danger Is There?

    100815 Hindenburg Crash"Friday the 13th" got a little scarier than normal as warnings were heard from many corners of the financial blogosphere that the Hindenburg Omen triggered.

    What is it?  It is a fairly obscure technical analysis pattern, which supposedly gives an early warning of unstable market conditions (and even potentially stock market crashes).

    While the calculation is based on five factors, the primary conditions indicate that there is a big disagreement about market conditions.

    For example, two of the conditions are that a substantial number of stocks have to be at yearly highs, while a substantial number of stocks have to be at new annual lows.  Ultimately, it is hard for those two conditions to be met in a short period of time, unless there's uncertainty in the market.  Moreover, after a rally, uncertainty is often a precursor to a decline.

    In addition, technically (in order for the pattern to be complete), a second sighting of the five elements must occur within 36 days. Logically, lingering uncertainty is a momentum killer.

    While this pattern has correctly predicted every big stock market swoon of the past two decades, including the October 2008 decline (that set the global economic recession into motion), not every Hindenburg Omen has been followed by a crash. Resorting to a geometry analogy: All rectangles are squares, but not all squares are rectangles.

    Personally, I don't make trade decisions based solely on indicators like this. Nonetheless, it has a pretty good track record, seems to be based on reasonable theories, and might be useful as just another data point urging caution.

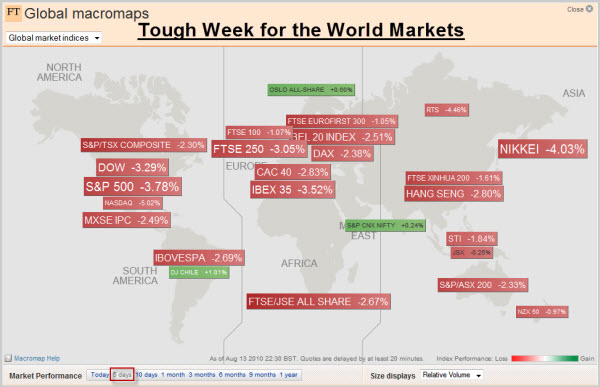
    Tough Week for World Markets.

    Taking a macro view, many markets around the world went down last week.  Notably, the NASDAQ was down 5%, the Nikkei was down 4%, and many other indices were down 3%.

    100813 Tough Week for World Markets

    Here in America, the Federal Reserve’s Open Market Committee startled financial markets by raising its terror alert level over the economy and declaring it would keep buying bonds to maintain its loose-money stance and fight deflation.  Despite the promise of help, the markets continued lower.

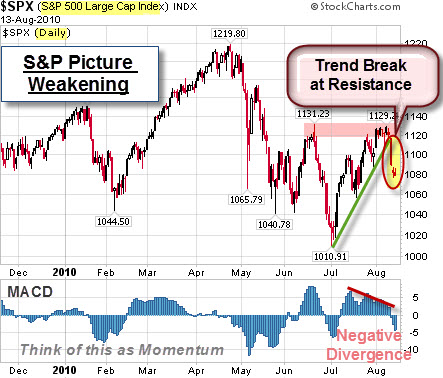
    Let's Look at a Chart of the S&P.

    What does a daily chart of the S&P 500 Index show?  Price has retreated from the resistance area (marked by the pink highlight).  In addition, price has gapped below the up-trend line (marked by the green line).  Combine that with a negative divergence in MACD momentum, and the picture is technically weaker than before.

    100815 SP500 Trend Break

    Bulls are looking for an oversold rally.  Bears are looking at the unfilled gaps as breakaway gaps.

    As always, it should be interesting.

    Business Posts Moving the Markets that I Found Interesting This Week:

    • Goldman Had 10 Days of Trading Losses in Q2. (WallSt&Tech)
    • The Options Market's Take On H-P: Frenzied Buying in Put Options. (Barrons)
    • Grand Tetons Possibly for Sale: Governor of Wyoming Says They Are Desperate. (Alternet)
    • How Far Should Google Go to Profit From the Data It Has About People's Activities? (WSJ)
    • Skype Files Plans for $100 Million IPO. (WSJ)

    Lighter Ideas and Fun Links that I Found Interesting This Week

    • Hedge Fund Predicts "Apple Will Sell 50 Million iPads A Year". (BusinessInsider)
    • Swarm Intelligence: Why Mimicking the Behaviour of Ants & Bees Is Smart. (Economist)
    • What Your Appetite Reveals About How Your Brain Works? (PsychologyToday)
    • BlackBerrys & Encryption – Spies, Secrets and Smart-Phones. (Economist)
    • Google Goggles Lets You Search the Web With Your Mobile Phone Images. (Kurzweil)
    Enhanced by Zemanta

  • Capitalogix Commentary for the Week of 08/09/10

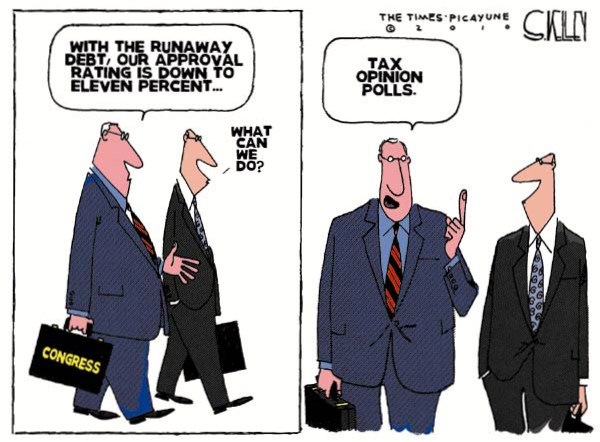
    There is a solution to everything.  Of course, some solutions are better than others.

    100807 Tax Opinion Polls - Kelley

    The government's latest snapshot of the job market was bleak, with 14.6 million Americans still searching for work.  The disappointment is not limited to July; the report also included unfavorable revisions to data released in previous months.  It is becoming clear that the existing policy mix is not appropriate for the task at hand.

    Even though we've heard bad news, the market has continued to hold up well. And that is a decidedly bullish sign.  There are also a number of positive signs of market strength (like strong breadth, increased corporate spending, and lots of capital on the sidelines ready to be deployed).

    Market Commentary:  Let's Look Under the Covers.

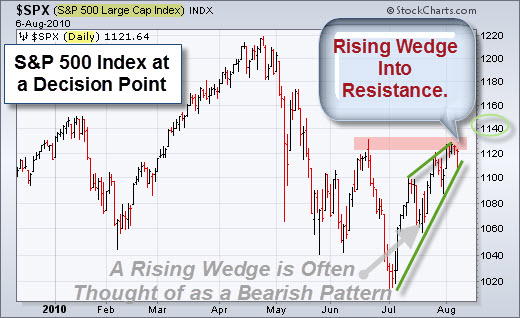
    The charts show a few challenges ahead, however.  First, the S&P 500 Index is sitting at a resistance zone in a rising wedge pattern.  From a technical analysis perspective, that pattern is often bearish (or the place traders look for a reversal).

    100808 SP500 at Resistance

    Bulls are looking for a sustained move above the 1140 level to make them comfortable.

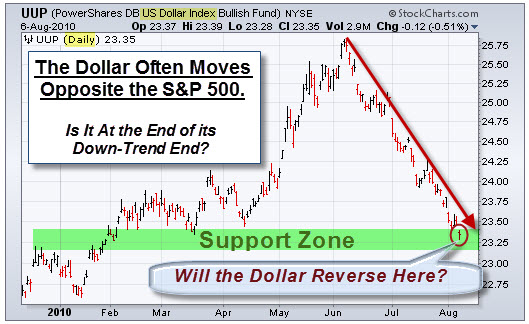
    Second, the Dollar looks like it might be at a support level. Will it reverse here?  These two markets often move counter to each other.  So, having the Dollar at "support" while the S&P 500 Index is at "resistance" might increase the odds of a market turn here.

    100808 Dollar at Support
    Just something to keep your eye on.

    Finally, this is from late May; but it is making the rounds again … and I thought it was worth sharing.

    Steve Wynn Is Not a Shy Man With Few Opinions.

    In this video, Steve Wynn (a casino resort/real-estate developer who has been credited with spearheading the dramatic resurgence and expansion of the Las Vegas Strip) calls out the White House and talks about the Fall of America. Interesting perspective from a billionaire.


    Business Posts Moving the Markets that I Found Interesting This Week:

    • Newsweek Sells For $1 To 92-Year Old Stereo Equipment Mogul Sidney Harman. (BizInsider)
    • Cheap Money: IBM Just Borrowed $1.5B at 1%, Via a Three-Year Bond. (WSJ)
    • Do Bond Yields Below 3% Signal a Double-Dip Coming? (Economist)
    • Sobering Stats: What Are the Odds That the Economy Is In Good Shape? (Insider)
    • For Fed, No Easy Answers in Easy Money. (WSJ)

    Lighter Ideas and Fun Links that I Found Interesting This Week

    • Former CIA Chief Says U.S. Strike on Iran More Likely Than Ever. (Slate)
    • Who Knew? Merriam-Webster Ask the Editor Video on the Plural of Octopus. (MW)
    • The Google Wave Shut-Down Decision Shows Strong Innovation Management. (HBR)
    • Superman Saves Family From Foreclosure – After Homeowners Find $250K Comic (Newser)
    • Food For Thought: Meat-Based Diet Made Us Smarter. (NPR)
    Enhanced by Zemanta