Trading

  • Capitalogix Commentary 10/11/10 – Until Sellers Get Bold

    Something's got to give – job growth and spending swing in the balance.

    101008 Economic Mood Swing Cartoon -  Jeff Parker

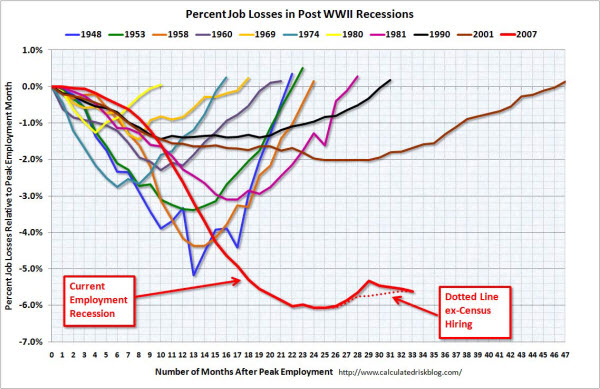
    The job loss situation continues to get worse.  This is still one of the scariest charts I've seen.  And the numbers continue their trend of downward revisions.


    101008 Job Losses In Recessions
    Market Commentary.

    The markets continue higher despite concerns about the economy.  Remember, the markets do not reflect what is happening in the economy (nor are they supposed to).  Markets reflect the expectations and speculations about the markets themselves. 

    There is a lot of money sitting on the sidelines, and if we don't get selling pressure — then it doesn't take much to push things higher. 

    The S&P 500 Has Risen Back to Its Down-Trend Line.

    The bigger picture shows that the S&P 500 Index has rallied back up to the trend-line from its 2007 highs.  Bulls will likely feel more confident if price can stay above this level.
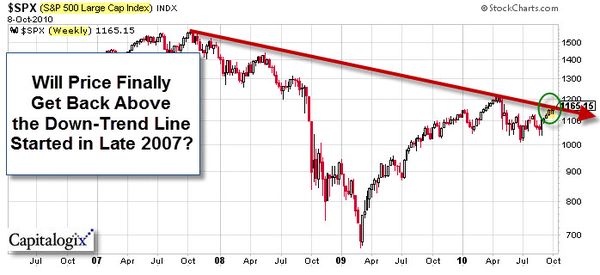
    101009 SP500 at Trend-Line

    How high can it go?  This is a likely area for Bears to try to sell.  Not only are we at overhead resistance, but the market is getting overbought.

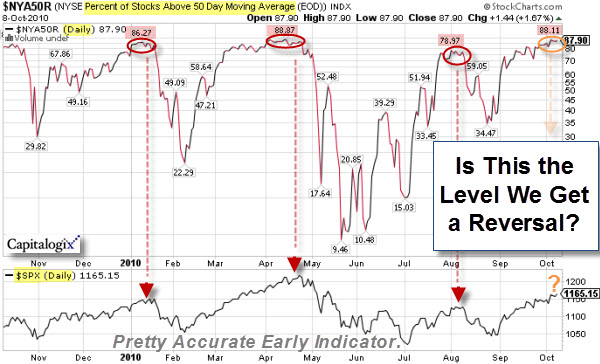
    How Can You Measure Whether the Market Is Overbought?

    More than 88% of all stocks traded on the NYSE are above their 50-day moving average.  We have seen similar levels three times in 2010, all resulted in large sell-offs. 

    101008 Percent of Stocks Above 50-Day Average

    The push higher will continue until sellers get more bold.

    Business Posts Moving the Markets that I Found Interesting This Week:

    • Propelling the Profit Comeback – Big Earnings From Lower Revenue. (WSJ)
    • Wall Street’s Profit Engines Are Slowing Down. (NYTimes)
    • Bernanke Says Fed's Additional Asset Purchases Improve Economy. (Bloomberg)
    • Where Every Major Country Is in the Global Debt Cycle. (BusinessInsider)
    • Just Manic Enough – Seeking Perfect Entrepreneurs. (NYTimes)
    • More Posts Moving the Markets.

    Lighter Ideas and Fun Links that I Found Interesting This Week

    Enhanced by Zemanta

  • Capitalogix Commentary 09/27/10 – Still Following the Script

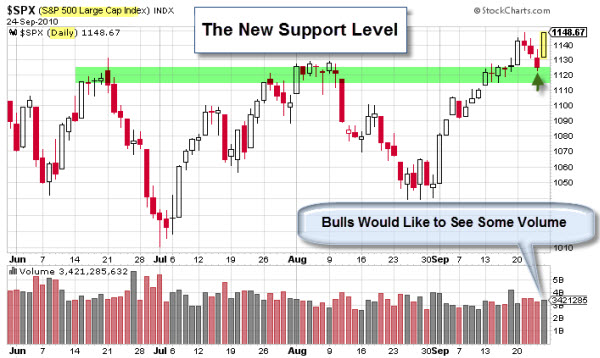
    The market followed it's well-orchestrated script last week. After finally pushing above the key resistance level, there was a pause, as we waited for buyers to jump in and rally things higher. However, the market saw little real buying, and prices drifted back down to re-test the 1020 support level. When the sellers didn't jump at the opportunity, it was time for another gap higher.  And that is exactly what we got.

    100925 SP500 Has a New Support Level

    What Does Wall Street Sentiment Show?

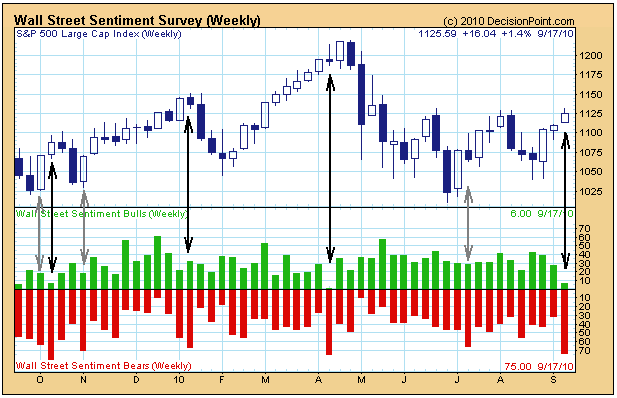
    The weekly Wall Street Sentiment Survey is unique because the poll is taken after the close on Friday, and those polled are asked only to predict where the market will close as of the end of the following week — up, down, or neutral (no opinion). In other words, everyone is on the same page, and only short-term projections are solicited.

    Carl Swenlin notes that bearish readings of greater than 65% often precede price tops by a week or two. Reliability seems to be enhanced if a high percentage of bears occurs during an advance.

    100925 Wall Street Weekly Sentiment Survey
    The most recent reading of 75% bears has occurred during a modest advance, so it is probably a good idea to curb bullish enthusiasm.

    Business Posts Moving the Markets that I Found Interesting This Week:

    • Volcker is Pessimistic, Says 'Financial System Is Broken'. (Dealbook)
    • The Housing Crisis: A New Wave Of Distressed Home Sales. (WP)
    • Do B-of-A Layoffs Signal Weakness in Investment Banking and M&A? (Fox)
    • Blockbuster Files for Bankruptcy. (Dealbook)
    • Dell Looks For $60 Billion in Revenue This Year. (Reuters)

    Lighter Ideas and Fun Links that I Found Interesting This Week

    • Bill Gates Tops Forbes 400 Ranking of Richest Americans With $54 Billion. (Bloomberg)
    • Is that Bill Gates Mug-Shot Hiding in Outlook 2010? I'll Bet He Didn't Know. (arstechnica)
    • Women Apologize More Frequently Than Men: Here's Why. (ScientificAmerican)
    • Michael Douglas Cashes-In Again on No. 1 'Wall Street'. (USAToday)
    • Myths That Everyone Believes. Well, not "Everybody" … (MyDoubts)
    Enhanced by Zemanta

  • Putting the Great Recession’s Duration Into Context.

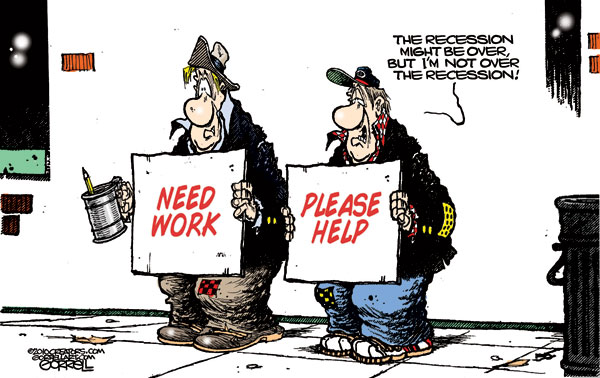
    This cartoon made me smile. 

    100925 Not Over the Recession Cartoon - Gorrell


    Are you over the recession?

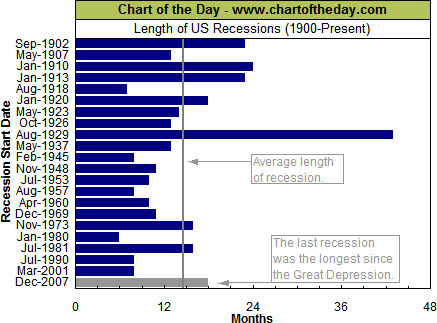
     Earlier this week, the National Bureau of Economic Research (the official arbiter of recession dates) declared that the recession that began in December 2007, ended in June 2009.

    For some perspective on the recession just past (a.k.a. the "Great Recession"), Chart of the Day illustrates the duration of all US recessions since 1900. There are a couple points of interest. Of the 22 recessions that occurred over the past 110 years, the most recent recession is tied for fifth in terms of duration. It is also worth noting that the recession just passed was above average in duration and the longest since the Great Depression.


    100924 Length of Recessions

     Well, now that the Great Recession is over, the rest should be easy … right?

    What About the Economy – How Did It Do in the Third Quarter?

    Clearly, unemployment and housing are two issues that need to improve to kickstart the economy.  Moreover, economic growth in the second quarter slowed to an anemic 1.6% from 5.0% in the December quarter, and 3.7% in the first quarter. 

    Because of this, the Fed has now signaled next round of Quantitative Easing, which likely will send the U.S. Dollar and bond yields to new lows, while sending stock and commodity prices materially higher.

    Do You Care if the Market Moves Because of Intervention?

    From my perspective, it doesn't matter that intervention is taking the place of the invisible hand and free-market pricing. From a traders perspectives, price is price. And, as I've discussed before, it also makes sense from a practical standpoint. If intervention is the policy, then it is best for it to happen during periods of slow market activity (because it's easier and cheaper to accomplish with less resistance).

    Nonetheless, it's also interesting to note how little organic buying and selling is happening in the equity markets. If you remove the moves made by (or on behalf of) governments, the trading required by ETF's or indexes, and the volume that simply comes from program trading or high-frequency trading … there's really not a lot of interest in the equity market right now.

    In contrast, however, asset classes like gold and bonds are seeing a lot of interest.

    But, if you are looking for something positive, remember that the "powers that be" officially declared the recession over.

    Enhanced by Zemanta

  • Capitalogix Commentary 09/20/10 – Why a Gap-Up is Likely

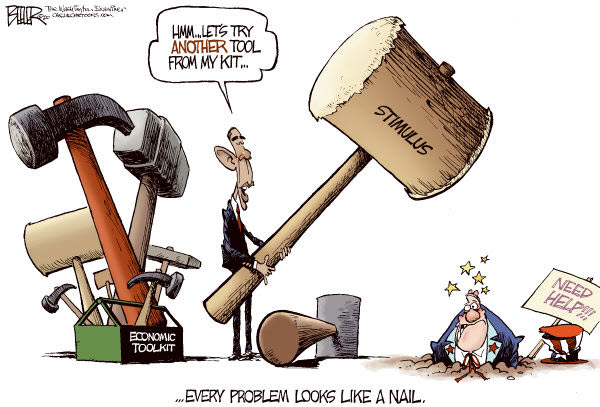
    When you have a hammer … every problem looks like a nail.

    100917 Every Problem Looks Like a Nail - Beeler

    Why Do the Big Gains Come on Monday Mornings?

    Bespoke posted an interesting piece that points out that much of the market gains this year occurred on Monday morning gaps.  Since the start of the year, there have been 11 times that the S&P 500 index gapped higher by at least 0.5% to start the week.  Looking at the equity market's performance for the rest of the day and the rest of the week shows a mixed picture.

    How can you explain the government's continued interventions?  If the government believes that intervening in the market is in the public's best interest, then the best way to push the market higher is to do it during light futures trading periods (like weekends or after-hours).  Why?  Because it takes less capital (and thus costs less to do it) after-hours than it would have during periods of thicker trading. 

    Remember, this is a free market; so if the market "disagrees" with the push higher, then sellers can freely take their profits or positions. The bigger issue, here, is that even though the markets have been pushed higher, we still haven't gotten to the point that triggers selling volume.
    Monday seems like a good time to expect the next gap up.  It would likely get prices above the clearly drawn line in the sand. 

    What Do the Charts Show?

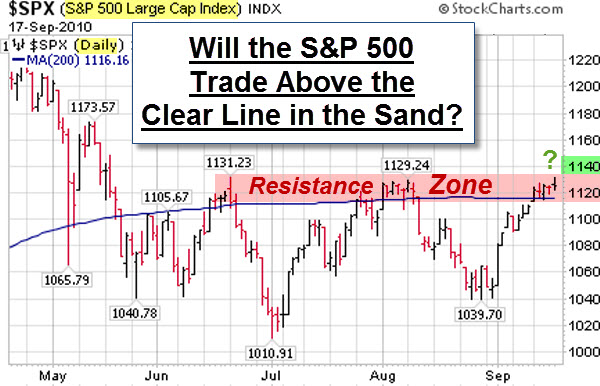
    The S&P 500 is testing the top of its four month trading range, sitting just under resistance.  Will the third time be the charm, or will there be a sell-off from this triple-top ?

    100917 SP500 Line in the Sand

    The past two times we saw failed rally attempts on declining volume before the market cratered.  A sustained move above the 1140 level will likely give the index plenty of room to rally. We'll see.

    Sentiment Has Flipped to Bullish.

    The American Association of Individual Investors (AAII) sentiment survey is interesting to watch. Retail investors are notoriously wrong at market turning points.  Consequently, many look at extreme readings of the AAII Sentiment Survey as a contrary indicator.  So, where is it now?

    Bullish sentiment (meaning expectations that stock prices will rise over the next six months) rose 7.0 percentage points to 50.9%. This is the highest level of optimism since August 13, 2009. The historical average is 39%.

    Bearish sentiment (meaning expectations that stock prices will fall over the next six months) fell 7.4 percentage points to 24.3%. This is the lowest level of pessimism since December 31, 2009.

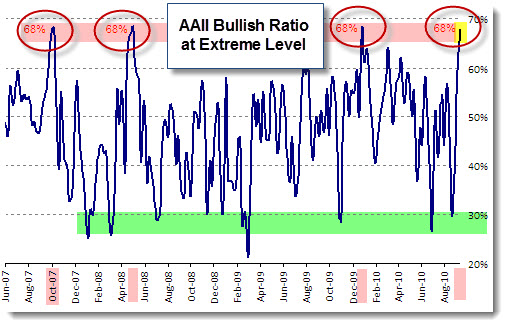
    Not only is the data at extreme levels, it also represents an abrupt sentiment reversal. Just four weeks ago in the late August reading of the AAII Bull Ratio (the percentage of bulls divided by the percentage of bulls and bear) fell below 30%. That level of pessimism is often seen at the turning point of significant market bottoms.

    In contrast, now we are seeing the opposite side of the sentiment spectrum.  The current reading of 51% bulls and only 24% bears, results in a bull ratio of 68% – the highest for the whole year.  That level of optimism is often seen at the turning point of significant market tops.

    100919 AAII bull ratio chart Sep 2010
    As you can see on the chart, in recent years, we’ve seen this level reached only a handful of times: in late December 2009, May 2008, and October 2007. A quick glance at the chart of the S&P 500 will tell you that all of those instances were much better times for selling rather than buying.

    Another market getting a lot of attention lately is Gold

    Soros: Gold "Not Safe".

    Billionaire financier George Soros said last week that while gold prices might continue to rise after hitting record highs, he renewed a warning that gold is the "ultimate bubble".  With economic and fiscal weakness crimping the developed world, Soros said all investments are at risk because "this is a period of great uncertainty so nothing is very safe." For more of his observations, watch this video.


    Business Posts Moving the Markets that I Found Interesting This Week:

    • Which Sector Do Experts Believe Will Lead the Next Bull Market? (Barrons)
    • Senate Clears $30B Small-Business Measure. (Newser)
    • The 10 Biggest Myths About Gold. (SmartMoney)
    • Pimco Makes an $8.1B Bet Against Deflation. (InvestmentNews)
    • Why Men Do Worse Than Women As Investors? (Forbes)

    Lighter Ideas and Fun Links that I Found Interesting This Week

    • Bull Market in Men's Cosmetics: Just Don’t Call it “Makeup”. (NYTimes)
    • Poll: 1-in-5 Incorrectly Think Obama is a Muslim. (Newser)
    • 1st Marijuana TV Ad Airs on a Fox Affiliate in CA: Smell the Taxes? (SFGate)
    • Japanese Men Flocking to Resorts With Video-Game Virtual Girlfriends. (TheWeek)
    • The 20 Richest People of All Time.  The list might surprise you.  (BusinessInsider)
    Enhanced by Zemanta

  • Capitalogix Commentary 09/13/10 – Pavlov’s Banker

    President Obama promised to roll-out “new ideas” to boost growth and spur hiring during an economy-focused trip to the Midwest. He says the economy is moving in “the right direction; we just have to speed it up.”

    Consequently, the President is asking Congress to help small businesses by passing legislation that includes $12 billion in tax breaks and $30 billion worth of aid to free up credit. The question, of course, is whether the White House can turn these ideas into a political reality.

    Seems to me I've seen this play a few times.

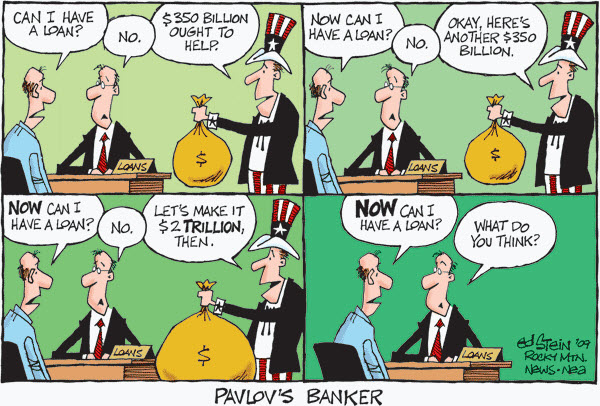
    100905 Pavlov's Banker - Stein

    Ed Stein reminds: "Every time these guys refuse to lend money, the government ponies up more billions. If it were me, I'd keep playing that game until the Treasury was empty, which apparently is exactly what the bankers are doing. There's a reason why they're rich."

    Market Commentary

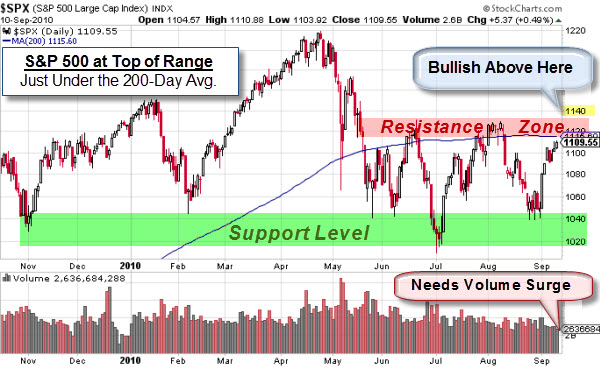
    The markets continued higher on light trading.  We are coming into the top of the consolidation zone.

    100911 SP500 Decision Zone

    There is not much to say, other than we are approaching a clear decision-zone.  A sustained move above the 1040 level will most likely trigger some real buying.

    Sign of the Times: McDonalds Hitting All-Time High.

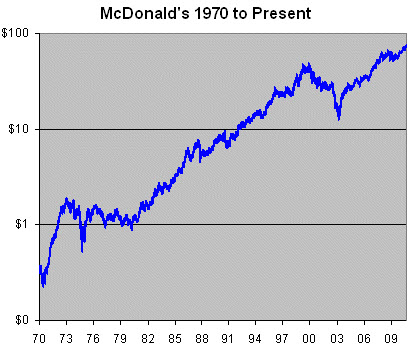
    Here is something we haven't seen often lately, a stock hitting all-time highs.  Well, McDonalds recently hit $75.13 which is a long way from the $13 it hit in 2003.  Must be the special sauce?

    100911 McDonalds at All-Time High

    Successful Patterns.

    100913 elephant-tracks Why do patterns work? 

    Elephants leave tracks … and smart traders follow the big money.

    Large traders like governments, sovereign wealth funds, or a mutual fund can affect markets while they buy or sell; however, when they're done, some other group's strategy becomes the dominant force.

    It is important to understand "who is in control"  not necessarily why they are trading.

    That means you don't have to figure out every bit of information or rationale behind their strategy in order to make money.

    For example, if you were about to walk into a movie theater, but were suddenly confronted with hundreds of people running in the other direction screaming, you don't have to understand exactly why it's happening in order to respond intelligently.

    On a superficial level, that's the basis of trend following.  It is also an example of pattern recognition.

    You Can Find Patterns Everywhere.

    If you don't believe there is a consistent formula for success, then you should watch this collection of songs made-up from the same four chords.  The video is from an Australian Comedy group, called "Axis of Awesome".

    Quite clever.

    Business Posts Moving the Markets that I Found Interesting This Week:

    • Goldman's Hedge Fund Factory Closing Due to New Regulatory Limits? (MarketWatch)
    • U.S. Economy Slips to 4th in W.E.F.'s Competitiveness Rankings. So Who's #1? (ABC)
    • Beware of Greeks Bearing Bonds: Another Great Michael Lewis Piece. (VanityFair)
    • The Scariest Boring Phrase In Finance: "Sovereign Credit Spreads Are Widening". (NPR)
    • MBAs Are For Wusses: In Israel, Start-Ups Fight for Army Veterans. (Economist)
    • More Posts Moving the Markets.

    Lighter Ideas and Fun Links that I Found Interesting This Week

    • Putting Things in Perspective: The World's Oldest Living Things. (TED)
    • Breath Like the Rest of the World: Fresh Air for Sale in Hong Kong. (GreenBlog)
    • Army Yoga: Making Soldiers Fit to Fight Without the Situps. (NYTimes)
    • Re-Thinking American Options About Iran. (Stratfor)
    • Mate Selection: Identifying Which Dance Moves Make Men Attractive to Women. (Economist)
    • More Posts with Lighter Ideas and Fun Links.
    Enhanced by Zemanta