Trading Tools

  • Wolfram’s Alpha Knowledge Engine

    I use Google without thinking.  It is a habit or a reflex.  That is about to change; at least for some types of information.

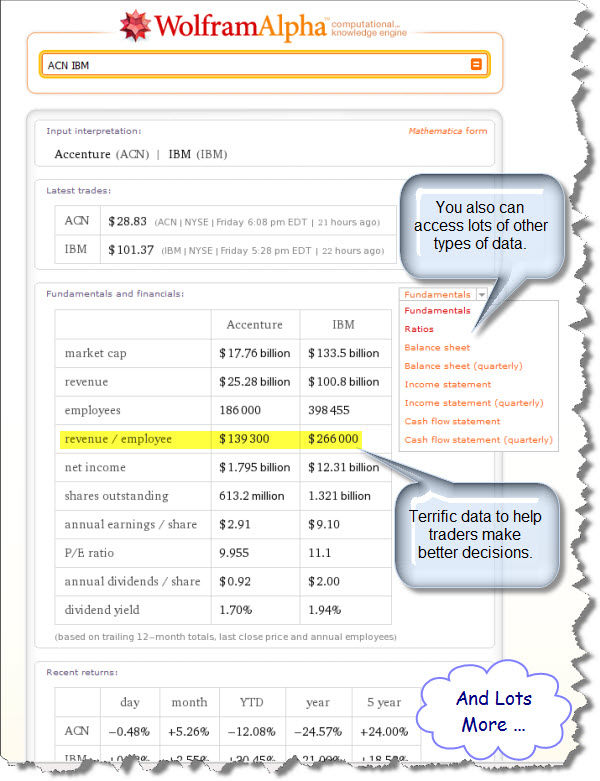
    They call it a "Computational Knowledge Engine" – but my tests tell me it does a lot more than what that means to me.  For example, here is a comparison of Accenture and IBM.

    090515 Wolfram Alpha

    Here is a link to a brief demo.  Take a look … I bet you shake your head and smile.  Progress is a beautiful thing.

    It does a lot more than calculate how many days you've been alive, amortize a mortgage, or tell you the flying time from Dallas to Paris.  Apparently the folks at Wolfram have a sense of humor too.  Here are some example searches that demonstrate that:

    Here is a summary of some more of the hidden tidbits from Mashable.

    Strangely, it doesn't know what a "computational knowledge engine" is … I guess that makes it more human.  It is easier to know lots of stuff than to be self-aware.

  • Capitalogix Commentary 04/17/09

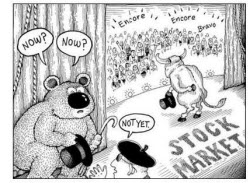
    090417 Bear in the Wings Stocks continued their advance this week.  The U.S. Markets moved higher for the sixth week in a row. Yet, it was just the seventh positive week for those indices in 2009. 

    It is worth noting that the bulk of earnings begin to hit this week. We'll see if people continue to buy into bad news. I'm watching for a change in sentiment.

    Long-Term Market Reminder: We have been in a bear market.  So, until proven otherwise, basic trend-following theory implies that the higher probability trades will be on the short side.  That means selling rallies until the bear market ends.

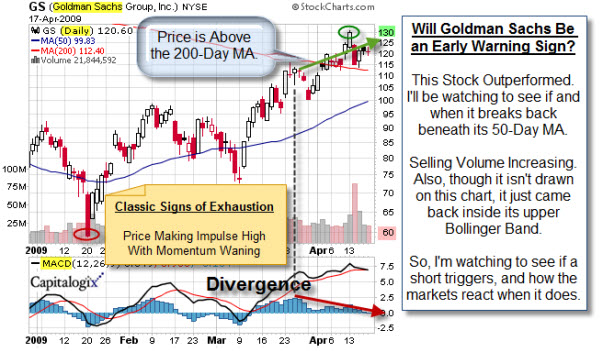
    I sense a renewed interest in the market recently by retail investors. For example, just this week I had conversations with several people telling me that they regret not buying Apple and Goldman Sachs while they were down.  I tend to hear this type of conversation at tops.  Here is Goldman's chart.

    090417 GS Topping

    It is also worth noting that there are reports that Goldman's Q1 Profit was non-recurring and a result of AIG unwinds. Add that to the fact that there we have seen poor bank earnings so far. Yet, it seems that the market sees a much higher likelihood of future financial solvency than it did just two months ago.  Still, this is a sector I'm watching for signs of weakness.  The next chart will explain why.

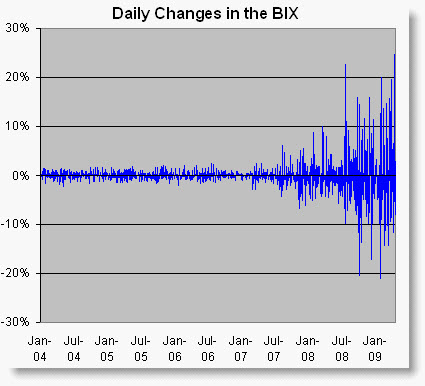
    Here is an interesting chart related to banks from Crossing Wall Street. It could be titled "The Earthquake That's Shaking Our Markets".  It shows recent volatility of Banking Index.

    090417 Daily Change in Banking Index Since 2004

    Finally, I thought this was funny. Our peaceful pacifist president has become Obama The Pirate Killer.  Yeah, I know, the SEALs did it … But I like the chart anyway.

    090417 Obama The Pirate Killer

    Business Posts Moving the Markets that I Found Interesting This Week:

    Lighter Ideas and Fun Links that I Found Interesting This Week

  • Another Type of Image Toy – Deep Zoom

    The new Deep Zoom technology in Microsoft's Silverlight is pretty cool.  The smooth in-place zooming and panning that Deep Zoom allows is a true advancement and raises the bar on image viewing. High resolution images need to be prepared for use with Deep Zoom to control the zooming experience.

    Here is an example.

    Also, here are three links worth exploring about Deep Zoom:

    • This is a Deep Zoom site of Hard Rock Café Memorabilia (Hard Rock)
    • This is a Barack Obama supporter site using Deep Zoom (Obama)
    • And finally, here is a demo of a web site designed for Deep Zoom (Vertigo)

    If you want a little more background on this, here is a post about why this technology is new and different.

  • Phi on Fibonacci and Markets

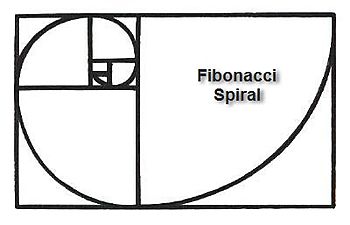
    FIBONACCI SPIRAL drawing
    As noted, 6/18 is "Phi Day" for Fibonacci aficionados. 

    So, here is a link to a description of the sequence on Prechter's Elliott Wave website.

    And here is a follow-up article.

  • Phi on Fibonacci and Markets

    FIBONACCI SPIRAL drawing
    As noted, 6/18 is "Phi Day" for Fibonacci aficionados. 

    So, here is a link to a description of the sequence on Prechter's Elliott Wave website.

    And here is a follow-up article.

  • “It’s About Time” — Or, Isn’t it?

    There is a difference between working on a problem and focusing on a solution.  Thus, trying to improve performance is different than focusing on limiting losses. 

    Einstein said: "We cannot solve our problems with the same thinking we used when we created them."

    It got me thinking. Most trading charts are time-based (meaning that price change is measured against time).  But maybe looking at price change in other ways would provide a different perspective.

     
    There are several interesting techniques gaining favor among technical traders.  These include measuring price change based on a certain volume traded or a constant range of directional movement.  Here is a link to a brief article about this in StockCharts.com.
     
    In some respects, these are "smoothing" techniques.  Nonetheless, they present a different picture of the market, and are something worth investigating.
     
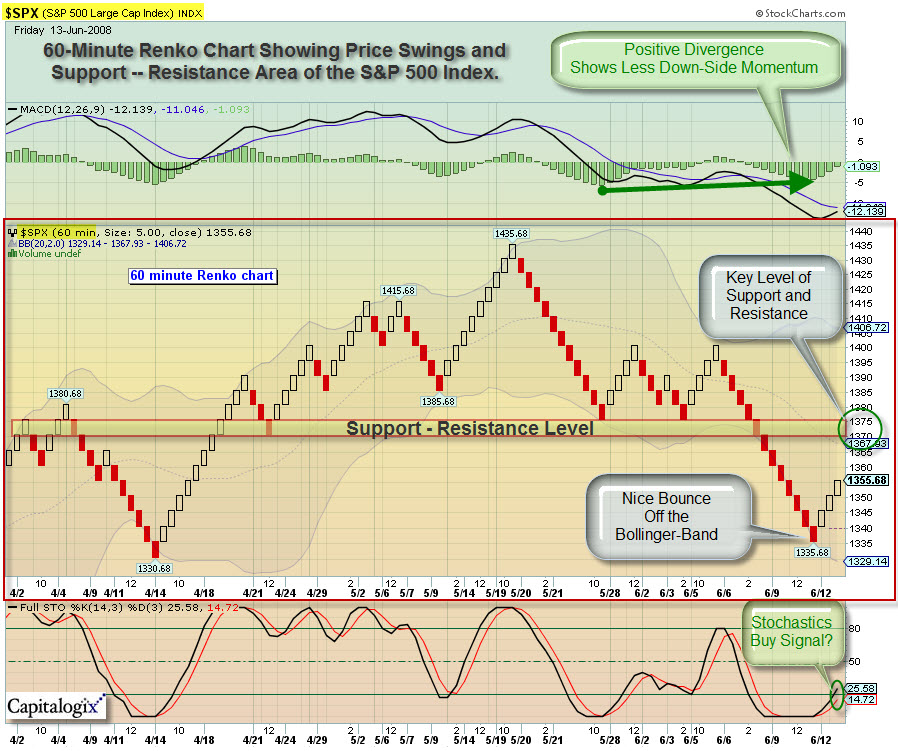
    Here is how the S&P 500 Index looks like in one of these charts.
     
    080613 SPX Renko Chart
  • Market Commentary as of June 6th, 2008

    This week the Markets
    tried to rally several times.  Unfortunately for the Bulls, none of
    these attempts worked.  And Friday's move down was the worst for the
    market in a year-and-a-half.

    So the headlines are "another week
    of a weak dollar, rising oil prices and falling markets."  One of the
    key take-aways, from my perspective, is that the Markets are not
    responding as resiliently to bad economic data as they had a few weeks
    ago.

    You don't have to look much farther than this chart from FinViz.com.
    080606 Red Heat Map from FinViz

    Also, something I'm hearing more of are questions about whether you can trust the government's economic numbers?  Some people are
    saying that key measures have been distorted lately.

    Some things that caught my eye this week: